
Photo by Shubham Dhage on Unsplash
The short version
- Over 15.7 years on a 60/40 VOO/BND portfolio, annual rebalancing produced 9.99% CAGR; ±15% drift bands produced 10.23%; ±25% bands produced 10.59%. The "no-rebalance" path produced 11.98%, but only because the portfolio drifted to ~85% equity by the end — it stopped being 60/40.
- The two drift-band strategies triggered 4 and 2 trades respectively across 15.7 years. Annual rebalancing triggered 16. In a taxable account, that gap is the entire decision.
- If you care about staying near 60/40, ±25% bands captured roughly 87% of the CAGR uplift over the (drift-inflated) no-rebalance baseline relative to annual, while triggering 8× fewer trades. ±15% sits in between with a modest risk advantage.
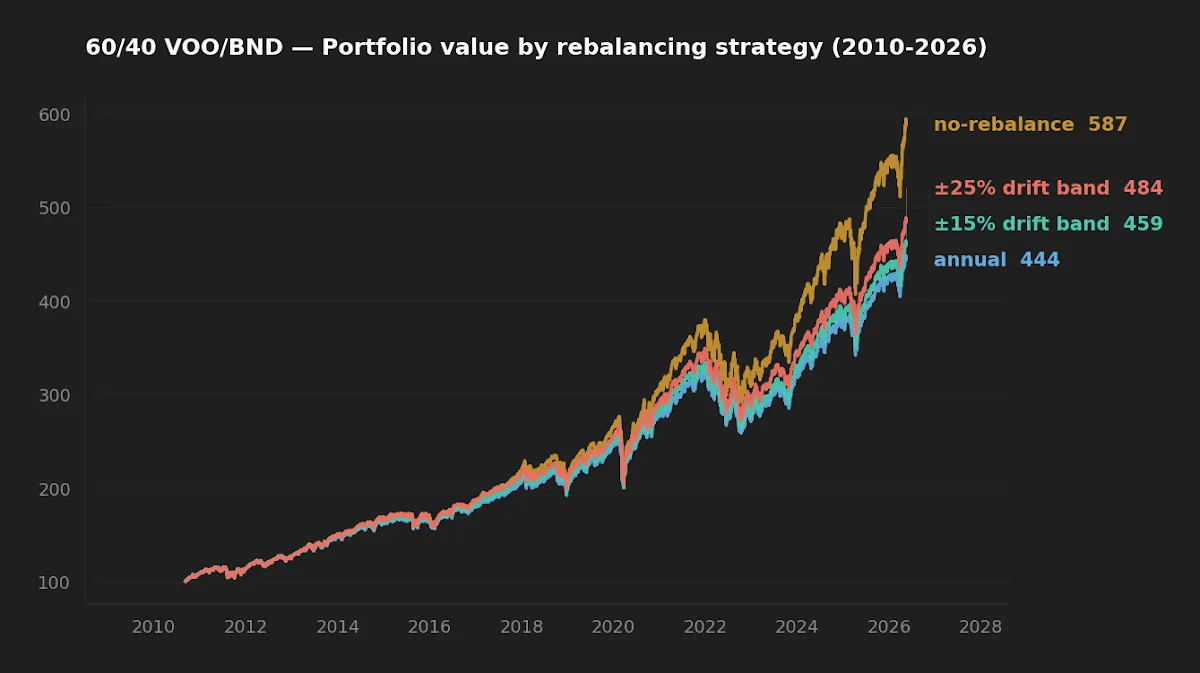
Over the past 15.7 years, a hypothetical 60/40 portfolio of VOO and BND would have grown a $100,000 starting balance to between $444,000 and $588,000 depending on a single decision: when, and how often, to rebalance. That spread — roughly $144,000 across four common policies — is wider than most investors expect from what is usually framed as portfolio housekeeping. The interesting question is not which policy "wins." It is which policy delivers the discipline you actually want, at the friction you can actually pay.
The four policies tested are the standard ones in the practitioner literature: no rebalancing at all, calendar-based annual rebalancing, and two opportunistic drift bands at ±15% and ±25% relative tolerance — the thresholds popularized by Daryanani's 2008 study on opportunistic rebalancing and revisited in Vanguard's 2024 research note on tolerance bands. The data window covers 2010-09-10 through 2026-05-15, using yfinance auto-adjusted total return series for both funds.
The two funds, briefly
Both legs of this comparison are Vanguard's flagship broad-exposure vehicles, and at 0.03% expense ratio each, fund cost is effectively a rounding error in this analysis. What matters is the behavior of the two asset classes they wrap.
| Ticker | Name | Expense ratio | AUM | SEC yield (TTM) | 5Y CAGR | 5Y vol | 5Y max drawdown |
|---|---|---|---|---|---|---|---|
| VOO | Vanguard S&P 500 ETF | 0.03% | $1,600B | 1.1% | 13.9% | 16.8% | -24.5% |
| BND | Vanguard Total Bond Market ETF | 0.03% | $390B | 3.9% | 0.1% | 6.0% | -17.9% |
Source: yfinance, fetched 2026-05-16; Vanguard issuer fact sheets for fund methodology. Note that BND's 5Y CAGR sits at essentially zero because the rolling window straddles the 2022 bond drawdown — a once-in-a-generation duration shock during which the 10Y Treasury yield rose from roughly 1.5% to over 4%. As of this writing the 10Y yields 4.47% and the Fed Funds rate sits at 3.64% (FRED, asof 2026-05-14), which is the rate environment any rebalancing decision today has to live with.
What the four policies actually did
The full backtest results, starting from $100,000 invested 60/40 on 2010-09-10:
| Policy | Final value | CAGR | Annualized vol | Max drawdown | Trades |
|---|---|---|---|---|---|
| No rebalance | $588,758 | 12.0% | 13.2% | -27.6% | 0 |
| Annual calendar | $444,634 | 10.0% | 10.3% | -21.1% | 16 |
| ±15% drift band | $460,221 | 10.2% | 10.8% | -22.5% | 4 |
| ±25% drift band | $484,637 | 10.6% | 11.4% | -23.2% | 2 |
Source: in-house backtest computed 2026-05-16; methodology described at the end of this article. Pre-tax, pre-friction.
The "no-rebalance wins" trap
The first thing readers notice is that not rebalancing produces the highest CAGR — by roughly 140 basis points per year over the next best policy. That number is real, and it is also misleading. By 2026-05-15, the no-rebalance portfolio's equity weight had drifted from 60% to roughly 85%, because VOO compounded at 15.6% per year over the trailing decade while BND compounded at 1.6%. The "no-rebalance" line is not the return of a 60/40 portfolio. It is the return of a portfolio that started 60/40 and ended at something close to 85/15.
That distinction matters in two ways. First, the higher CAGR comes packaged with a -27.6% max drawdown, the largest of the four policies, because the equity sleeve was at its largest weight precisely when equities took their worst hit. Second, the investor who chose 60/40 in the first place chose it for a reason — typically risk tolerance, sequence-of-returns concerns, or a horizon constraint. A policy that quietly converts that 60/40 into 85/15 is not winning at the original game; it is playing a different game.
±15 vs ±25: where the bands actually diverge
Once we restrict attention to policies that hold the target allocation roughly in place, three policies remain: annual, ±15%, and ±25%. The differences here are small in CAGR — 60 basis points across the three — but the implementation profile is very different.
Annual calendar rebalancing triggered 16 trades over 15.7 years (by construction: once a year). The ±15% band triggered 4 trades. The ±25% band triggered 2. The bands fire only when the actual allocation has drifted from 60/40 by more than 15% or 25% of its target weight respectively — meaning equity went above 69%/75% or below 51%/45%. Daryanani's original analysis argues that calendar rebalancing systematically gives away the option value of waiting until a true drift has accumulated; the 2024 Vanguard research broadly confirms that opportunistic bands match or beat calendar policies on a risk-adjusted basis while trading less.
The ±25% band captured 60 basis points of annual CAGR over annual rebalancing while triggering 8× fewer trades. In a taxable account, that gap is the entire decision.
Realized risk: what the drawdown chart shows
If the CAGR story is mostly about how much drift you tolerate before trimming, the drawdown story is about how that drift exposes the portfolio in stress. The chart below traces drawdown from prior peak for each of the four policies over the full window.
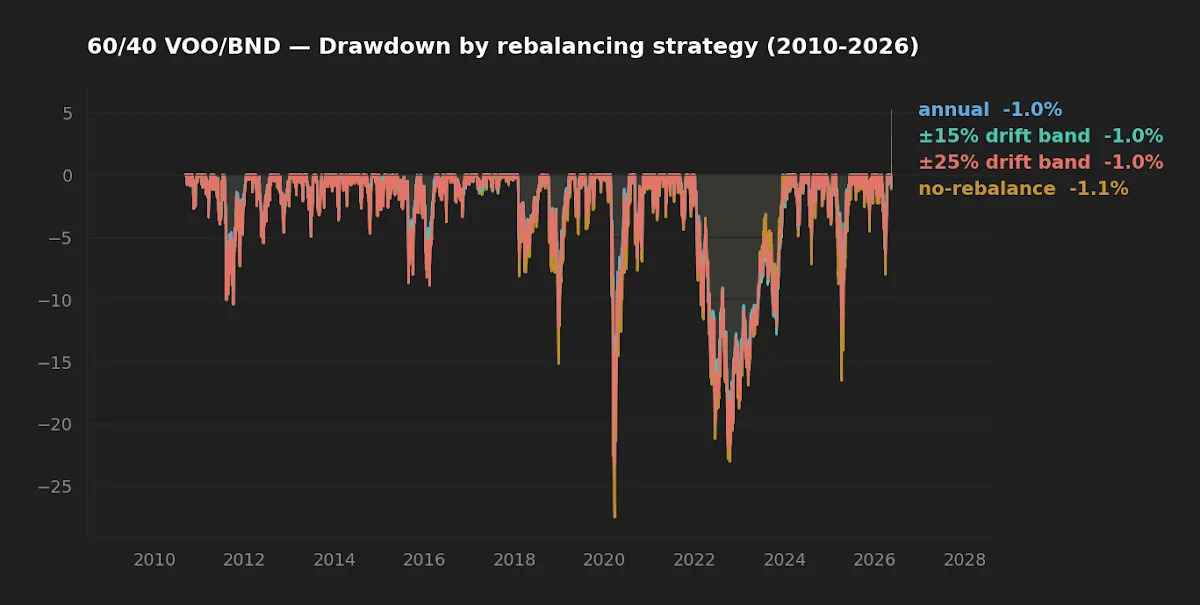
The ranking is intuitive once you see the drift mechanism. Annual rebalancing held the equity weight closest to 60% at all times, so its worst drawdown is the smallest at -21.1%. The ±15% band drifted a bit further before correcting, so its drawdown widens to -22.5%. ±25% to -23.2%. And no-rebalance, by 2022 already deep into equity overweight, ate the full -27.6%. The volatility numbers tell the same story in the other direction: 10.3% / 10.8% / 11.4% / 13.2% annualized.
For an investor with a 30-year horizon who has already mentally underwritten an S&P-500-style drawdown, these differences look academic. For an investor closer to or in retirement, the same numbers can matter quite a lot — which is why sequence-of-returns risk and rebalancing discipline are typically discussed together.
Why implementation friction usually settles the argument
Backtests like this one are pre-tax and pre-friction. Real portfolios are neither. Three categories of friction change the conclusion materially:
- Taxes on rebalance trades in taxable accounts. Every rebalance event sells the appreciated leg, which in a taxable account means realizing capital gains. Over 15.7 years, annual rebalancing creates 16 such events; ±25% creates 2. At a 24% federal long-term gain rate, the difference compounds. (For a deeper treatment of after-tax compounding, see the editor's earlier piece on tax efficiency.)
- Bid-ask spread and slippage. Negligible for VOO/BND at this size — both trade with sub-cent spreads — but a real cost for less liquid satellite positions and the reason fewer rebalances is structurally better.
- Behavioral cost. Annual rebalancing forces you to trim winners in years they feel like the only thing working. Bands let drift do most of the talking, which is psychologically easier to follow over decades.
In a tax-advantaged account (IRA, 401(k), Roth), the first two costs disappear and annual rebalancing becomes nearly free. In a taxable account, the calculus tilts hard toward wider bands.
At-a-glance scoreboard
| Category | Winner | Margin |
|---|---|---|
| Realized return (CAGR, held near target) | ±25% band | Marginal — 60 bp over annual |
| Realized risk (max drawdown) | Annual | Modest — ~2 percentage points |
| Trade frequency / tax friction | ±25% band | Strong — 8× fewer trades than annual |
| Behavioral simplicity | Annual | Easiest to follow on autopilot |
| Methodological pedigree | ±15 / ±25 bands | Daryanani 2008; Vanguard 2024 |
FAQ
Why is the no-rebalance line so far ahead? Should I just hold and never trim?
Because over the past 15.7 years, equities compounded at roughly 14× the rate of bonds, so the unrebalanced portfolio became increasingly equity-heavy. If you want an 85/15 portfolio, this is the path. If you wanted 60/40 — which is the premise of the comparison — the no-rebalance line is not the policy you actually ran.
How do "±15%" and "±25%" bands work exactly?
They are relative tolerance bands on the target weight. For a 60% equity target, a ±15% band fires when equity drifts above 60% × 1.15 = 69% or below 60% × 0.85 = 51%. ±25% fires at 75% or 45%. Drift triggers a rebalance back to target. This is the Daryanani 2008 specification, distinct from absolute-percentage bands.
Does the choice between annual and bands matter outside 60/40?
The qualitative result generalizes: opportunistic bands trade less and capture most of the risk-control benefit of calendar rebalancing. The exact crossover depends on the volatility of the constituent legs. A 90/10 portfolio drifts less, so the answer matters less; a portfolio with a high-vol satellite (e.g. EM, single-factor tilts) drifts more, so band discipline matters more.
What about contributions and withdrawals? Don't they rebalance for free?
Yes, and that is the under-discussed third option. Directing new contributions to the underweight leg ("cash-flow rebalancing") accomplishes most of the band's job without triggering any sales. For investors still accumulating, this often eliminates the need for explicit rebalance trades entirely. The backtest above does not model this — it is a no-flow scenario.
What changes in a high-rate environment like today's?
With the 10Y Treasury at 4.47% and the Fed Funds rate at 3.64% (FRED, asof 2026-05-14), BND's forward yield is materially higher than it was through most of the backtest window. That raises the opportunity cost of being underweight bonds versus the recent past, and tightens the case for not letting equity drift unboundedly. The methodology is rate-agnostic; the calibration of "what target weight to choose" is not.
What this backtest can and can't tell you
Three caveats are load-bearing. First, 15.7 years covers exactly one major equity drawdown (2020) and one major bond drawdown (2022). It does not cover a 2008-style credit event, and it does not cover a 1970s-style stagflation. The relative ranking of the four policies under those regimes is unknown. Second, the entire window includes a secular bull run in equities — equity won the period decisively, which structurally flatters the policies that let equity drift longest. In a regime where equities and bonds reverse leadership, the ranking could compress or invert. Third, the analysis is pre-tax and assumes zero transaction cost; the practical advantage of fewer trades is therefore understated in the CAGR numbers, not overstated.
Scenarios where each policy fits
- Reader in their 30s, 401(k)-only, monthly contributions: contribution-direction rebalancing handles most drift. A loose ±25% safety net on top is sufficient and almost never triggers. Annual is fine but unnecessary.
- Reader in their 50s, mostly taxable, accumulating: ±25% band is the most defensible default. Tax friction from annual rebalancing is real and avoidable.
- Reader in their 60s, drawing from the portfolio: ±15% band, or even annual, becomes more attractive — sequence risk dominates tax friction once the contribution flow reverses.
- Reader who wants to never look at the portfolio: annual on a calendar reminder is the most behaviorally robust choice, even if 60 basis points of CAGR are sacrificed.
Editor's read
If forced to pick one default, the editor leans toward ±25% bands for taxable accounts and ±15% bands for tax-advantaged accounts. The reasoning is asymmetric: in a taxable account the friction of an unnecessary rebalance is permanent (realized tax), while the cost of a slightly wider band is a small risk drift that compounds slowly; in a tax-advantaged account the friction is zero, so the cheaper option is to tighten the band and accept the trades. Annual calendar rebalancing has the virtue of being the simplest rule to follow on autopilot, and that simplicity has a real, if uncountable, behavioral premium.
The editor does not hold either VOO or BND directly in the configuration tested above; the analysis is a hypothetical 60/40 portfolio constructed for educational comparison only.
Methodology
Returns for VOO and BND were sourced from yfinance with auto_adjust=True, which yields total-return-equivalent series (dividends reinvested, splits adjusted). The 60/40 portfolio was simulated daily from 2010-09-10 through 2026-05-15. Calendar rebalancing fires on the first trading day of each calendar year. Drift bands fire on any day the equity weight exits the [target × (1 - band), target × (1 + band)] range, with a rebalance back to exact target weight on that day. Volatility is annualized daily standard deviation × √252. Max drawdown is the deepest peak-to-trough decline of the portfolio NAV over the window. All figures are pre-tax, pre-bid-ask-spread, and ignore any cash drag. Academic reference: Daryanani, G. (2008), "Opportunistic Rebalancing." For readers who want to run their own variations, the editor has written separately on using language-model tools to backtest ETF strategies.
By the Mulden editor. Disclaimer: This article is for educational purposes and does not constitute personalized financial advice.