
Photo by and machines on Unsplash
The short version
- MTUM is a $24B rules-based momentum factor ETF charging 0.15%. AMOM is a $30M AI-overlay product charging 0.75%. The construction philosophies are different, but the live-track-record gap is not subtle.
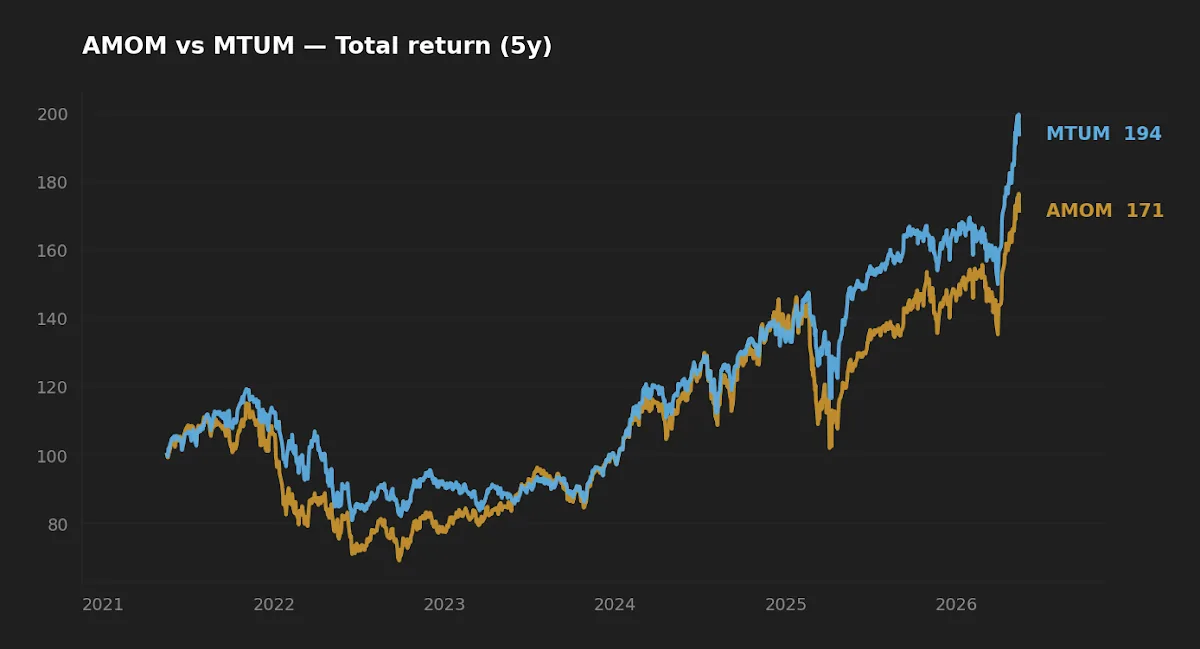
- Over the past five years, MTUM compounded at 13.9% with a -32.3% max drawdown; AMOM compounded at 11.3% with a -40.0% max drawdown. Higher fee, lower return, deeper drawdown.
- Bottom line: MTUM is the credible momentum vehicle for most long-horizon investors. AMOM remains a satellite-only research bet on a specific thesis about machine-learned factor rotation — a thesis the live data does not yet support.
The pitch behind AMOM is intuitive: momentum is one of the most robust empirical anomalies in equity markets (Jegadeesh & Titman, 1993; Fama-French five-factor extensions), and a deep-learning model trained on a wider feature set should, in principle, time exposures more precisely than a semi-annual rules-based screen. The question that matters for a long-horizon investor is not whether the AI premise is interesting. It is whether AMOM's actual implementation has earned the right to displace MTUM as a momentum sleeve — particularly given a 60 basis point annual fee differential that compounds every year, regardless of model conviction.
The five-year live data tells a clear story, and it is not the story the AMOM marketing wants told.
How AMOM and MTUM define "momentum"
MTUM tracks the MSCI USA Momentum Index, which scores large- and mid-cap US stocks on risk-adjusted 6-month and 12-month price momentum, normalizes the scores, and reconstitutes the basket semi-annually. The methodology is public, transparent, and has been in continuous operation since April 2013. There is no model in the loop — only a deterministic ranking applied to a defined universe at defined dates.
AMOM, run by QRAFT Technologies, applies a proprietary deep-learning model on top of a Russell 1000-style universe to select roughly fifty names, with monthly reconstitution. The model is trained on price, fundamental, and macro features and is marketed as identifying "AI-enhanced" momentum signals. Crucially, the model's parameters and feature weights are not disclosed at the security level — it is a black-box overlay relative to MTUM's transparent factor index. For a discussion of how AI-managed funds frame their pitch versus what the data shows, the earlier deep dive into AIEQ and AMOM covers the broader AI-ETF category; the comparison here narrows to the head-to-head against the standard momentum factor.
Side-by-side: the numbers as of 2026-05-16
| Metric | AMOM | MTUM |
|---|---|---|
| Issuer | QRAFT | iShares (BlackRock) |
| Inception | 2019-05-20 | 2013-04-16 |
| Expense ratio | 0.75% | 0.15% |
| AUM | $30.5M | $24.2B |
| NAV | $57.41 | $298.36 |
| Dividend yield (TTM) | 0.1% | 0.7% |
| 5Y CAGR | 11.3% | 13.9% |
| 10Y CAGR | n/a (insufficient history) | 16.3% |
| 5Y annualized volatility | 23.7% | 20.5% |
| 5Y max drawdown | -40.0% | -32.3% |
| Rebalance frequency | Monthly | Semi-annual |
Data sources: yfinance (price/return series), pulled 2026-05-16. Expense ratios and AUM cross-checked against issuer fact sheets — iShares MTUM product page and QRAFT's AMOM fund page. Macro context: 10-year Treasury yield 4.47%, VIX 17.26 (FRED, asof 2026-05-14).
Construction: rules versus model
The methodological asymmetry matters more than it first appears. MTUM's index is auditable: a researcher can replicate the rank order from public price data. AMOM's selections are not — the model can change its emphasis without an externally visible rule change. That is either a feature (adaptive) or a defect (no fixed contract with the investor about what they own), depending on perspective. For a buy-and-hold investor whose thesis is "I want disciplined exposure to risk-adjusted price momentum in US large caps," MTUM delivers exactly that on a published schedule. AMOM delivers whatever the model decides momentum looks like this month.
Monthly reconstitution also implies higher portfolio turnover. The issuer-disclosed turnover for AMOM has historically run materially above MTUM's — relevant for taxable accounts via realized short-term gains and for the underlying tracking error against any "pure" momentum factor. The comparison of MTUM and QUAL against VOO covers how smart-beta funds drift in and out of their advertised factor over time; AMOM's drift is harder to measure because the target itself moves.
Cost: what 60 basis points compounds to
Fee drag is the most under-discussed feature of factor ETFs because it operates silently. The math is uncomplicated. On a $50,000 position held for 20 years at an assumed 8% gross compounding rate, the difference between paying 0.15% and 0.75% in annual expenses is roughly $24,000 in terminal value lost to fees — about 10% of the ending balance. That is the fee math before any return differential. In the present case, the live return differential runs the same direction: AMOM has compounded slower, so the realized opportunity cost is larger than the fee table alone implies.
This is the part of the AI-ETF pitch that proponents have to confront honestly. The model has to be good enough every year to overcome a 60-basis-point headwind. Over five years of live data, it has not been. That does not prove the model cannot work in the future — but it is the relevant evidence in front of us, and pricing it at zero would be motivated reasoning.
The AI-enhancement story is asked to overcome a 60-basis-point fee headwind every year. Over five years of live data, it has not — AMOM has trailed MTUM by 260 basis points annualized while taking on more risk.
Realized risk and drawdown behavior
The return gap is part of the story. The risk gap is the other part, and for a long-horizon investor it is the part that determines whether the position is survivable. Annualized volatility was 23.7% for AMOM versus 20.5% for MTUM over the five-year window. Max drawdown reached -40.0% for AMOM versus -32.3% for MTUM. The risk-adjusted ratio (CAGR/volatility, a rough Sharpe-style proxy excluding the risk-free rate) is 0.48 for AMOM and 0.68 for MTUM — a meaningful spread.
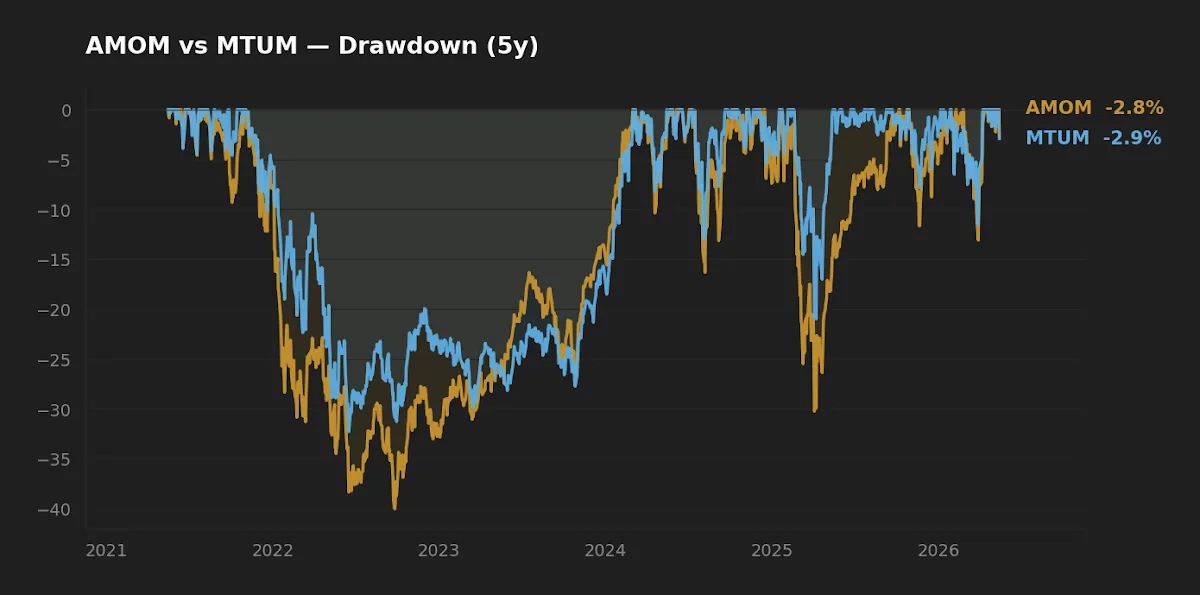
Inspecting the drawdown curves matters more than the single max-drawdown number. The shape of AMOM's deepest drawdown — its drawdown duration and the speed of recovery — is what tells you whether the model adapted to the regime change or got run over by it. A higher-turnover momentum strategy that fails to rotate out of decelerating leaders is exposed to exactly the whipsaw the AI-overlay narrative is supposed to mitigate. The 7.7-percentage-point max drawdown gap, in MTUM's favor, is the most expensive cost AMOM has paid for its complexity.
One regime caveat is important here: the five-year window includes the 2022 rate-shock drawdown but does not include a credit-event-driven recession in the 2008 sense. Any verdict on momentum strategies that survives only growth-shock drawdowns is provisional. The 10-year MTUM record (16.3% CAGR) spans a wider set of regimes and gives more confidence in the factor's persistence; AMOM has no equivalent.
Capacity, AUM scale, and the closure question
Here is the non-obvious point most reviews of AMOM skip. After almost seven years in market, AMOM holds approximately $30 million in assets. MTUM gathers that in roughly one trading day of net inflows during a momentum regime. The 800× AUM ratio is not just a popularity contest — it is a structural signal.
A sub-$50M ETF carries several investor-relevant frictions: wider bid-ask spreads relative to NAV, less robust authorized-participant arbitrage, higher per-investor share of fixed fund expenses, and — most importantly — non-trivial closure risk. ETF issuers regularly close products that fail to scale; if AMOM closes, taxable holders realize gains or losses on the issuer's timing rather than their own. None of this is a verdict on the AI strategy itself. It is a verdict on the practical implementation: a long-horizon investor wants to be confident the vehicle will still be there in 20 years. With AMOM at this AUM level, that confidence is reasonably lower than with MTUM.
At-a-glance scoreboard
| Category | Winner | Margin |
|---|---|---|
| Cost | MTUM | Material — 60 bp |
| Realized return (5Y) | MTUM | Significant — 260 bp/yr |
| Realized risk (5Y vol) | MTUM | Modest — 320 bp lower vol |
| Realized drawdown (5Y) | MTUM | Material — 770 bp shallower |
| Transparency / auditability | MTUM | Strong |
| Scale and closure resilience | MTUM | Decisive — 800× AUM |
| Adaptive optionality (if AI works) | AMOM | Conceptual; unproven live |
Editor's read
For a long-horizon investor wanting a momentum sleeve in a core-satellite framework, MTUM is the credible vehicle. The 60 bp fee gap is unforgiving over decades, the construction is auditable, the AUM removes closure risk, and the 13-year live track record covers more regimes than AMOM's six. AMOM is interesting only as a small research position for an investor who already has broad-market and factor exposure covered, who specifically wants to bet on the thesis that machine-learned factor rotation will outperform a rules-based screen over time, and who is willing to monitor closure risk. As of mid-2026, the live evidence does not yet support that thesis — but the editor would not call the case closed either.
FAQ
Is AMOM's AI overlay just a marketing label, or is there a real model?
There is a real model — QRAFT publishes high-level descriptions of its deep-learning architecture and uses it across a family of products. The question is not whether the model exists but whether its live alpha, net of the 0.75% fee, has beaten the simpler MTUM benchmark. Over five years, it has not. Whether that is small-sample noise or a structural verdict requires more time to know.
Why is MTUM so much cheaper if it is supposedly a "factor" product?
MTUM tracks a published MSCI index. Index licensing plus systematic rebalancing is inexpensive at scale, and BlackRock's $24B AUM allows the fee to be spread across a large asset base. AMOM's cost reflects active model maintenance plus the fact that fixed fund operating costs are spread across only $30M.
Does the higher dividend yield on MTUM matter?
MTUM's 0.7% TTM yield versus AMOM's 0.1% is not the headline story — momentum strategies are not income vehicles — but the composition of underlying holdings differs enough to produce that gap. In a taxable account, the qualified-dividend portion is taxed favorably; in a tax-advantaged account, the distinction is immaterial.
Should I worry about AMOM closing?
It is a reasonable risk to price in. ETF closures usually come with 30-60 days notice and the fund is liquidated at NAV; investors are not wiped out, but the timing of any taxable gain is forced. For a non-taxable account, the friction is mostly transaction cost. For a taxable account, it can be more meaningful.
Is momentum as a factor still working?
The academic consensus is that price momentum has been one of the most persistent cross-sectional anomalies globally, though it has periodic crashes (notably 2009 and 2020). MTUM's 16.3% 10-year CAGR is consistent with the factor continuing to deliver a premium net of cost. AMOM's record is too short to opine on independently.
What this comparison can and can't tell you
Five years of live AMOM data is one regime, not a stress test. The window covers the 2022 rate shock and the subsequent recovery, but not a credit-event-driven recession. The factor literature is mature for MTUM-style momentum and provisional for AI-overlay strategies. The comparison here treats fees, realized returns, realized risk, and structural friction (AUM, closure risk) as evidence — none of which is forward-looking. A reader who believes the AI model will improve over the next decade should weight the unobserved future differently than someone who treats the live record as the best estimate of expected behavior. For a broader framing of how AI-driven and traditional ETFs fit together in one allocation, the hybrid portfolio framework covers the construction logic.
Scenarios where each fund actually fits
- Reader in their 30s building a 30-year core, already holds broad-market exposure, wants disciplined factor tilt: MTUM is a defensible 5-15% satellite. AMOM does not have the live record or the scale to justify replacing it.
- Reader with conviction in machine-learned factor rotation as a structural improvement: AMOM as a small (1-3%) research position, sized so closure or further underperformance is survivable. Not in lieu of MTUM.
- Tax-sensitive taxable account investor: MTUM's lower turnover and larger AUM dampen capital-gains distribution risk; AMOM's higher turnover and smaller scale increase it. MTUM is the cleaner choice.
- Reader who only wants one momentum sleeve and does not want to monitor it: MTUM. AMOM at $30M AUM is not a "set and forget" position.
Key takeaways
- Cost. AMOM charges 5× MTUM's expense ratio. Over multi-decade horizons, that compounds into a material drag that the model has to overcome before any alpha shows up.
- Live record. AMOM has underperformed MTUM by 260 bp annualized over five years while running 320 bp higher volatility and a 770 bp deeper drawdown.
- Scale. The 800× AUM gap is not cosmetic. It implies closure risk, wider spreads, and structural friction for the smaller fund.
- Construction. MTUM is auditable; AMOM is a black-box overlay. For a buy-and-hold investor, that asymmetry matters.
- Verdict provisional. Five years is one regime. AMOM may yet justify itself in a different cycle. Today, the burden of proof has not been met.
Editor's holdings disclosure: The editor does not hold either AMOM or MTUM at the time of writing.
Methodology. Price and total-return series were retrieved via yfinance on 2026-05-16, covering a five-year window ending the same date. Expense ratios, AUM, dividend yields, and inception dates were cross-checked against issuer fact sheets (iShares MTUM product page; QRAFT AMOM fund page). Macro context (10-year Treasury, VIX, Fed Funds, CPI YoY) was sourced from FRED as of 2026-05-14. Risk-adjusted return is a simple CAGR-to-volatility ratio and excludes the risk-free rate — directionally informative, not a full Sharpe calculation.
This article is for educational purposes and does not constitute personalized financial advice. See full Disclaimer.