
Photo by Defne Kucukmustafa on Unsplash
The short version
- VOO and IVV both charge 0.03%. The fee debate ends in a tie, which means the right framework question is no longer "which is cheaper?" but "which one tracks its index more faithfully?"
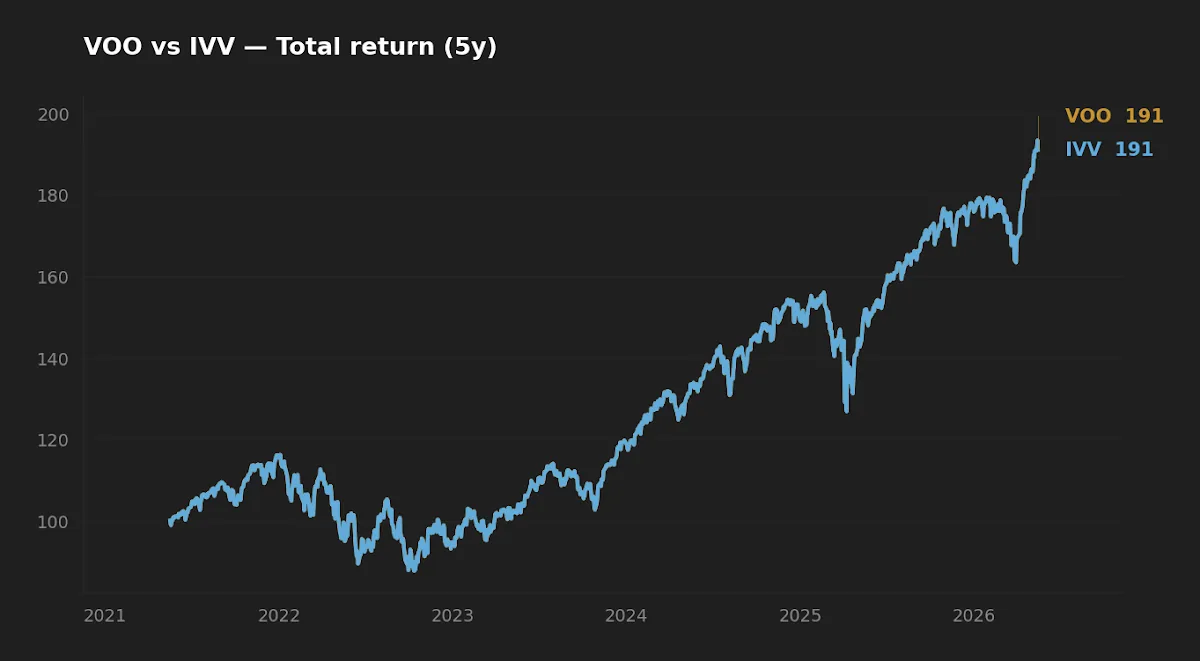
- Over the past five years, the realized CAGR gap between the two has been roughly a tenth of a basis point. Both funds track exceptionally well — neither has a structural edge.
- Tracking error becomes a first-order decision criterion in places where the expense ratio is small, the fund is small, or the index is hard to replicate. For a flagship S&P 500 wrapper, it is a tie-breaker, not a thesis.
When two S&P 500 ETFs both charge three basis points, the expense-ratio conversation is over before it begins. What remains is a number most retail commentary skips: tracking error — the annualized standard deviation of fund return minus index return after fees. With VOO and IVV tied at the same headline cost, the implementation work each fund does (or quietly fails to do) is the only place a sustainable performance gap can hide. The interesting question for a long-horizon investor in 2026 is not which fund is cheaper. It is how to reason about the implementation residual that the fee number does not capture.
Why this framing matters in 2026
The industry has spent fifteen years compressing fees toward zero on broad-market exposures. SPY, VOO, IVV, and SPLG now sit between 0.02% and 0.0945% on essentially the same index. For most long-term core allocations, the fee differential between the cheapest credible options has shrunk to a single-digit basis point. At that scale, a tracking-error gap of one or two basis points per year is not noise — it is the same order of magnitude as the fee itself.
Vanguard's VOO and iShares' IVV are the two largest S&P 500 ETFs not branded SPY, holding $1.60 trillion and $797 billion in assets respectively (yfinance, asof 2026-05-16). Both are full-replication funds tracking the same index, run by issuers with thirty-plus years of indexing infrastructure. The reasonable prior is that their tracking quality is so close that the choice is effectively a coin flip — but priors need to be checked against data, not assumed.
VOO and IVV side by side
| Metric | VOO | IVV |
|---|---|---|
| Issuer | Vanguard | BlackRock / iShares |
| Inception | 2010-09-07* | 2000-05-15 |
| Expense ratio | 0.03% | 0.03% |
| AUM | $1,600.2B | $797.5B |
| Dividend yield (TTM) | 1.1% | 1.1% |
| 5Y CAGR (total return) | 13.9% | 13.9% |
| 10Y CAGR (total return) | 15.6% | 15.5% |
| 5Y realized volatility | 16.8% | 16.9% |
| 5Y max drawdown | -24.5% | -24.5% |
Source: yfinance, fetched 2026-05-16. Expense ratio and methodology confirmed via the Vanguard VOO fund page and the iShares IVV fund page. *VOO inception date here reflects ETF launch; yfinance reports the legacy mutual fund inception of 2000-11-13 for the underlying strategy.
What the fee number leaves out
An expense ratio is a disclosed deduction. It is the contractual fee the fund company subtracts from NAV each day. Tracking error is everything that happens around that deduction: securities-lending revenue earned by the fund and credited back to shareholders, the timing of dividend reinvestment, the cost of trading when the index reconstitutes, the choice between full replication and statistical sampling, and the cash drag from holding short-term liquidity to handle redemptions.
The math is unforgiving when fees are already tiny. If VOO charges 3 bp and delivers a 2 bp tracking error in one direction, the all-in cost of ownership is 5 bp — two-thirds higher than the headline number. If IVV charges 3 bp and recovers 1 bp through lending revenue, the all-in cost is 2 bp. A retail investor staring at the prospectus would conclude the two funds cost the same. The investor staring at five years of realized returns sees a different picture.
This is why, when fee compression hits the wall it has hit on broad-market US equity, the analytical center of gravity has to move. The same three-basis-point fee can mean different things in practice depending on what the issuer does after the deduction.
Where tracking error actually comes from
For an S&P 500 ETF, the structural sources of tracking error are well understood:
- Replication method. Both VOO and IVV use full replication — they hold all 500 names. This eliminates sampling error, which is the dominant source of tracking error in funds covering harder-to-replicate indices (small caps, emerging markets, high-yield credit).
- Securities lending. Both issuers lend portfolio securities to short sellers and pass the bulk of the revenue back to the fund. Vanguard returns 100% of lending revenue (net of agent fees) to the fund; iShares historically returns a smaller share. For mega-cap US equity, lending revenue is modest — borrow demand is low because shorting the S&P 500 broadly is expensive — but it is not zero.
- Dividend reinvestment timing. Index returns assume immediate reinvestment of dividends. Funds reinvest in practice with a small lag, which becomes a drag in rising markets and a tailwind in falling ones.
- Reconstitution trading. When S&P removes a company and adds another, every index-replicating fund has to trade simultaneously. The funds that handle this well, through patient execution and avoiding the closing auction crush, save basis points each year.
- Cash drag. Funds hold a small cash buffer for redemptions. In bull markets, this drags returns by a few basis points relative to the index. In drawdowns, it cushions.
None of these is large in isolation for an S&P 500 fund of this scale. Together, they explain why the realized CAGR gap between VOO and IVV is roughly a tenth of a basis point per year rather than zero.
The expense ratio is what the fund discloses. Tracking error is what the fund actually delivers — and when fees are three basis points, the gap between those two numbers can be larger than the fee itself.
What the realized data tells us
Over the past five years, VOO compounded at 13.886% and IVV at 13.888% (yfinance total return, asof 2026-05-16). The difference is roughly 0.1 bp per year — well inside any measurement noise from dividend reinvestment timing and rounding. Realized volatility differs by 7 bp annualized, also inside the noise band. Maximum drawdown over the window was -24.5% for both, separated by a single basis point. By every realized-data measure, these two funds are statistical twins.
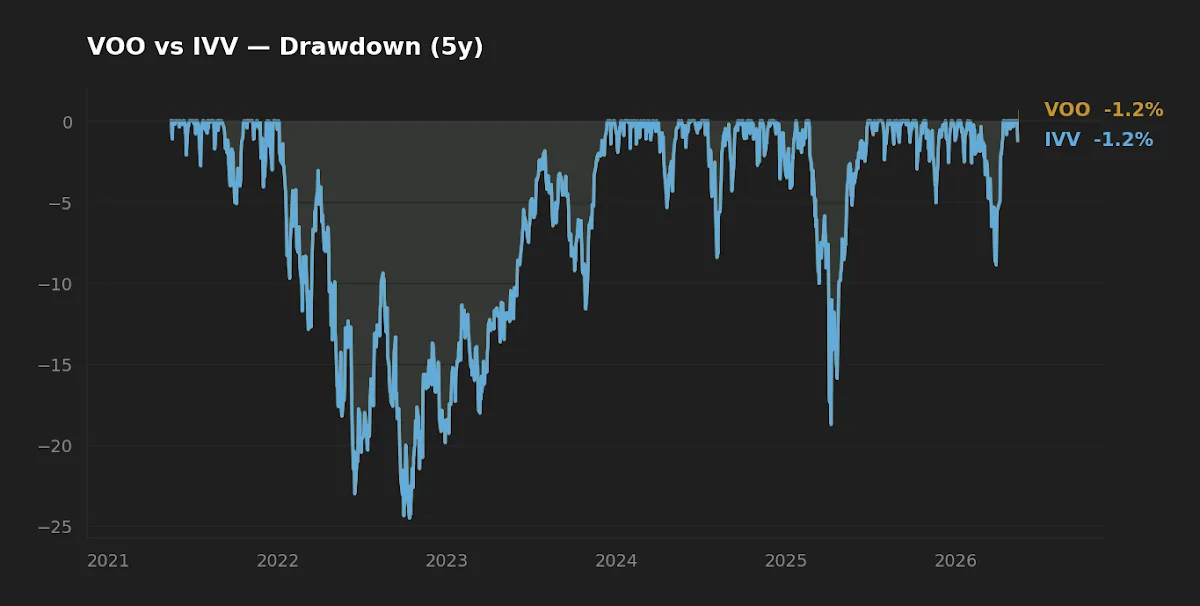
This is not an accident, and it is not a coincidence. Both funds are run by indexing teams that have been doing this for decades on multi-hundred-billion-dollar pools. At that scale, the operational details — when to trade reconstitutions, how to structure the lending book, how aggressively to use creation-redemption mechanics for tax efficiency — are mature enough that the marginal advantage between issuers has compressed to near-zero.
The non-obvious takeaway: scale itself produces tracking convergence. At $797B in AUM, IVV has crossed every operational threshold where issuer-specific edge could manifest. The interesting analytical work on tracking error is no longer happening on broad-market US equity ETFs. It is happening on funds two orders of magnitude smaller.
When tracking error becomes a first-order decision
The framework matters most outside the S&P 500 wrapper aisle. Three situations where tracking error deserves more attention than the fee:
- Small or new ETFs (under $1B AUM). Capacity constraints, wide bid-ask spreads, and forced sampling all push realized returns away from the index. A factor ETF with $200M in assets can easily underperform its backtested index by 50–100 bp per year for reasons that have nothing to do with the fee.
- Hard-to-replicate indices. Anything involving small caps, emerging-market local currency, high-yield credit, or international micro-caps tends to be sampled rather than fully replicated. Sampling error is non-trivial — and asymmetric, since the omitted securities are often the most illiquid and most likely to surprise.
- Active and smart-beta funds with index reference. Here the relevant gap is not tracking error against the underlying index but information ratio against a comparable benchmark. The same statistical framework applies: variance of excess return matters as much as the mean.
For investors building factor sleeves around a broad-market core, this is the right place to spend analytical effort — the topic we covered in Why "Factor Investing" Still Works: Applying Fama-French Models in the AI Era and the implementation work in Why VOO Is Not Enough: The Math Behind Adding AVUV and VXUS.
How to measure tracking error yourself
The standard calculation: compute daily fund total return minus daily index total return, take the standard deviation of the differences, and annualize by multiplying by the square root of 252. The fund's annual reports typically disclose annual tracking difference (mean return gap) but rarely tracking error (volatility of that gap) — though both are useful.
For a quick check, compare the fund's CAGR over a multi-year window against the index's published total return for the same window. The difference should be close to the expense ratio for a well-run full-replication fund. If it is materially larger, the fund is leaking value somewhere. If it is materially smaller, the fund is recovering value (typically through securities lending). For a broad-market ETF at scale, the realized gap should land within 1–3 bp of the disclosed fee — which is exactly what VOO and IVV show.
At-a-glance scoreboard
| Category | Winner | Margin |
|---|---|---|
| Cost (expense ratio) | Tie | Both 0.03% |
| Realized 5Y tracking quality | Tie | Inside the noise band |
| Realized 5Y return | Tie | ~0.1 bp/yr |
| Drawdown behavior | Tie | 1 bp separation |
| AUM / liquidity | VOO | Roughly 2x IVV by assets |
| Lending-revenue policy | VOO (marginal) | Returns 100% to fund |
Frequently asked questions
Is tracking error the same as tracking difference?
No. Tracking difference is the mean gap between fund and index returns over a period. Tracking error is the standard deviation of that gap — how consistent the tracking is. A fund can have zero tracking difference and high tracking error if it alternates between leading and lagging the index in equal measure.
Why are VOO's and IVV's expense ratios identical?
Vanguard and iShares both reduced their S&P 500 ETFs to 0.03% to defend market share against ultra-low-fee entrants. Below this level, the economics of running an index fund get tight even at $800B+ AUM, since revenue has to cover trading infrastructure, regulatory compliance, and distribution.
Does securities lending make a fund riskier?
Marginally. The fund accepts collateral (typically cash or Treasuries) worth more than the loaned security, but there is residual counterparty risk if the borrower fails and the collateral falls in value simultaneously. For mega-cap US equity ETFs run by Vanguard and iShares, the lending books are conservatively managed and historical loss rates are extremely low.
If VOO and IVV are statistically identical, does the choice matter at all?
For tax-deferred accounts, effectively no. For taxable accounts, the choice can matter at rebalancing time — owning the alternative wrapper lets you tax-loss-harvest one against the other without triggering a wash sale. This is a non-trivial reason some investors hold both.
How does this framework apply to leveraged or thematic ETFs?
Tracking error in leveraged funds is dominated by daily-rebalance path dependency, not by the operational sources discussed here — a different problem entirely. We covered that mechanism in Why Most Investors Misunderstand Leveraged ETFs: The Compounding Truth.
What this analysis can and cannot tell you
Five years of realized data on two mature index ETFs is informative but limited. The window covers one major drawdown (2022), one strong recovery (2023–2024), and a tightening cycle — meaningful regime variation, but not a 2008-style credit shock or a 2000-style growth-stock unwind. If either fund had an operational weakness that manifests only under extreme redemption pressure, this window would not have surfaced it. Both issuers have managed S&P 500 funds across earlier crises (IVV since 2000, Vanguard's index lineage further back), so the operational record is broader than the five-year window suggests — but recent realized tracking is not a guarantee of future tracking quality.
Scenarios where the choice between VOO and IVV matters
- Long-term holder in a tax-deferred account. The choice is genuinely a coin flip. Pick on broker preference, share-price ergonomics (IVV's higher per-share price may matter if your broker lacks fractional shares), or which one your employer plan offers.
- Taxable account with active tax-loss-harvesting. Holding the alternative wrapper available for the swap is the standard playbook. Owning one and rotating into the other after a drawdown captures the loss without changing market exposure.
- Investor consolidating accounts at a single broker. Pick whichever the broker treats as commission-free in dividend-reinvestment programs. This is a 1–2 bp consideration that swamps any structural difference between the funds.
- Institutional or large-block investor. Liquidity matters. VOO has roughly twice the AUM and tighter bid-ask spreads at size, which is the only category where the difference between these two funds is consistently measurable.
Editor's read
On the funds themselves, this is a coin flip and should be treated as one. Both are excellent. The real takeaway of this comparison is not "VOO or IVV" — it is a framework lesson: when fees compress to near-zero, tracking error becomes the operative cost number, and the only places it still matters are funds that are small, new, or replicate hard indices. Spend the analytical effort there — on factor sleeves, on small-cap value, on international exposures — not on choosing between two virtually identical S&P 500 wrappers. The discipline applies to the whole portfolio, as the long-horizon discussion in ETF Millionaire Reality makes clear: basis points compound, but only if you are spending your attention where they actually accrue.
The editor holds a broad-market US equity ETF position as part of a long-term core allocation. Which specific S&P 500 wrapper carries that exposure is not material to the analytical conclusion above.
Methodology. Return, volatility, drawdown, and dividend-yield figures are computed from daily adjusted-close data via yfinance, fetched 2026-05-16. The five-year window covers 2021-05-16 through 2026-05-16; CAGR uses total return assuming dividend reinvestment. Expense ratios and replication methodology were cross-checked against the Vanguard and iShares fund pages linked in the data table. Macro reference points cited elsewhere on the site reference FRED series; none are used here. All figures are point-in-time and will drift; treat this as a methodology piece rather than a current-price recommendation.
This article is for educational purposes and does not constitute personalized financial advice. See Disclaimer.