
Photo by Steve A Johnson on Unsplash
The short version
- DBMF doesn't forecast markets. It reverse-engineers the factor positioning of the top managed-futures hedge funds from their reported returns and replicates that exposure using cheap, liquid futures.
- At 0.85% the fund is roughly half the all-in cost of a traditional CTA, but it's still six times the cost of a broad equity index fund. The case for owning it lives or dies on diversification, not absolute return.
- Five years of live data — 8.8% CAGR, 12.6% volatility, a -20.4% peak-to-trough drawdown — places DBMF firmly in the satellite category for a long-horizon investor, not the core.
The interesting question about DBMF isn't whether the "AI-managed" label on the wrapper is doing real work — it mostly isn't, and we'll come to that — but whether the underlying mechanism actually delivers what an investor would expect from a managed-futures sleeve. That mechanism is unusual enough to be worth understanding properly: a single ETF that replicates the consensus positioning of the largest trend-following hedge funds, derived from regression on their reported returns, implemented in liquid futures, at a fraction of the fees those underlying funds charge.
Whether that combination earns a place in a long-horizon portfolio depends less on the headline 5-year return than on the role the investor wants the position to play. This deep dive examines DBMF's methodology, its realized behavior since 2019, the honest limits of what we can infer from six years of live data, and where the fund fits — and where it doesn't.
What DBMF actually does
The iMGP DBi Managed Futures Strategy ETF is run by Dynamic Beta Investments. Its approach, marketed under the "Dynamic Beta" name, is not in any meaningful sense a machine-learning system. The "AI" framing common in third-party coverage is a stretch. What the model is is a 60-day rolling multivariate regression: it takes the reported returns of an index of the largest managed-futures CTAs, regresses those returns against a basket of liquid factor proxies (equity index futures, government bond futures, FX forwards, commodity futures), and uses the resulting factor loadings to construct a portfolio that should track the index going forward.
This is replication, not prediction. The fund never forms a view on whether crude oil will rise or fall. It observes that the top CTAs, collectively, are net long crude — inferred from how their returns moved when crude moved — and takes a corresponding long crude position. When the CTA universe rotates, the regression picks up the new positioning with a lag and DBMF rotates with it. The model's edge, if it has one, is that it captures the consensus output of an industry of forecasters without needing to forecast itself, and without paying the 2-and-20 fee structure those forecasters typically charge.
The honest framing matters. Readers who arrive expecting an algorithmic trend-following system in the tradition of Renaissance's Medallion are looking at the wrong product. DBMF is closer in spirit to a smart-beta index fund pointed at an alternative asset class, where the "index" is the implied positioning of a hedge-fund peer group.
The data
| Metric | DBMF | GLD (reference) |
|---|---|---|
| Issuer | iMGP / DBi | State Street / WGC |
| Inception | 2019-05-07 | 2004-11-18 |
| Expense ratio | 0.85% | 0.40% |
| AUM | $3.5B | $153.5B |
| Distribution yield | 5.2% | 0.0% |
| 5Y CAGR | 8.8% | 19.4% |
| 10Y CAGR | n/a (post-2019) | 13.2% |
| 5Y realized volatility | 12.6% | 17.9% |
| 5Y max drawdown | -20.4% | -21.0% |
Source: yfinance (price and return), issuer fact sheets (iMGP DBi DBMF, SPDR Gold Shares), as of 2026-05-16.
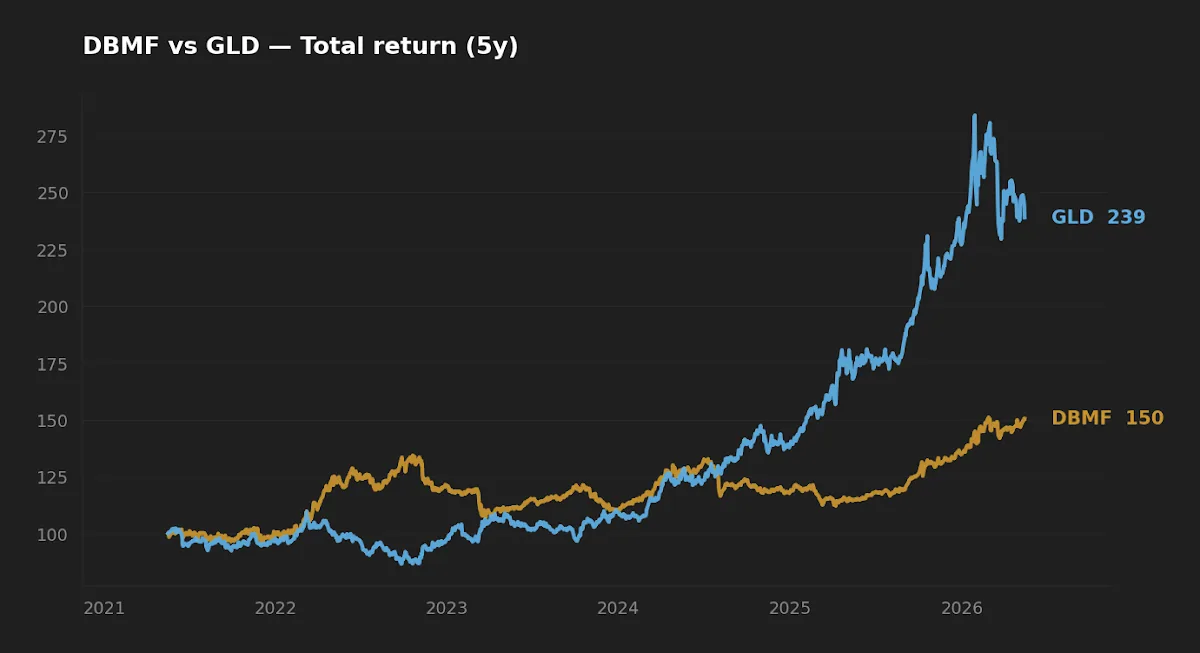
Gold is included as a reference asset, not as a head-to-head competitor. Readers comparing the two as alternative diversifiers can also see the dedicated piece on GLD vs. DBMF. The remainder of this article focuses on DBMF itself.
The "no forecasting" claim, decoded
The replication model has one structural property that genuinely distinguishes it from discretionary or signal-driven trend funds: there is no forecast horizon. The regression is backward-looking by construction. If the CTA universe took two weeks to identify a new trend in long-end Treasury yields, DBMF will be at least as late, because the regression cannot infer their new positioning until that positioning shows up in their returns.
This lag is the model's main cost. It is also the reason DBMF tends to capture the persistent middle of large trends — multi-month moves in rates, FX, or commodities — while missing both the early entry and the sharp reversals that hurt trend followers most. The 5-year period the fund has lived through (2020–2025) included exactly the kind of multi-quarter, cross-asset trends that this kind of strategy is designed to capture: the 2022 rates selloff, the 2022 dollar move, the 2023–2024 yen weakness, and the 2024–2025 gold and copper trends.
What the model does not give the investor is any meaningful behavioral hedge in a sudden, single-day risk event. The factor loadings come from regression on the prior period; they will look wrong, by construction, on the day a trend reverses violently.
The fund doesn't predict trends. It copies the homework of managers who are paid to find them, and charges roughly half the tuition.
Realized risk: what the drawdown profile reveals
The headline number — a -20.4% peak-to-trough — looks reassuringly close to GLD's -21.0% over the same window. The shape of the path is different in ways that matter.
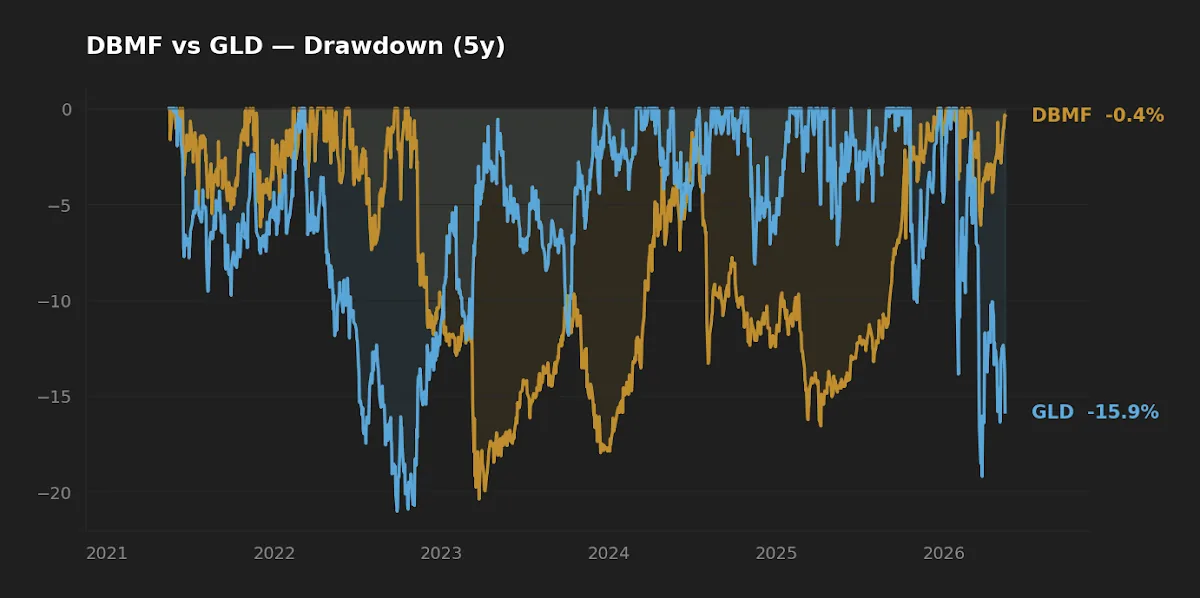
Gold's drawdowns are correlated with real-rate spikes — they tend to be relatively short, sharp, and to recover when the rate move stabilizes. DBMF's worst drawdown sits in a different regime: the model gets caught when trends reverse simultaneously across multiple asset classes, which is exactly what happened during the late-2022 to early-2023 mean reversion in rates and commodities. Recovery time was meaningfully longer than the loss period — a familiar pattern for trend strategies and one the academic literature on managed futures (e.g., Asness, Moskowitz, Pedersen) documents.
For a portfolio decision, the relevant question is not whether DBMF "lost less than equities in 2022" (it did) but whether the conditional behavior — losing slowly during trend reversals after periods of strength — is one the investor can sit through.
Cost: 0.85% in context
The expense ratio is the part of DBMF that most often gets framed wrongly in retail coverage. Two reference points anchor the right interpretation.
Against the traditional CTA fee structure — typically a 1–2% management fee plus a 15–20% performance fee — DBMF's flat 0.85% is a substantial discount, particularly because the fund passes through none of the high-water-mark friction of the underlying funds. For an investor who wants managed-futures exposure and would otherwise consider an institutional CTA, the comparison is favorable.
Against a broad-market index ETF at 0.03%, the same 0.85% is 28x more expensive. Compounded over a 30-year horizon at an 8% gross return assumption, the cumulative drag from 0.82 percentage points of incremental fee is roughly 22% of terminal wealth. That math doesn't make DBMF a bad fund. It does mean the position needs to do diversification work that a cheaper alternative cannot — otherwise the fee is paying for a return stream the investor could get more cheaply elsewhere.
Where DBMF sits in the AI-and-quant ETF universe
For readers tracking the broader category, DBMF behaves quite differently from the equity-side "AI-managed" funds covered in the piece on AIEQ and AMOM, and differently again from the systematic-active products discussed in the AI agents and active management piece. DBMF's bet is structural — that the median CTA has a real edge, and that liquid futures replication can capture most of it after fees. The equity-side AI ETFs are making a different bet: that a model can pick better stocks than the index.
At-a-glance scoreboard
| Category | Verdict | Note |
|---|---|---|
| Methodology transparency | Strong | Regression-based, explicitly disclosed |
| Cost vs alternatives | Material — half a CTA, 28x an index fund | Use case dependent |
| 5Y realized return | 8.8% CAGR — adequate for a satellite | Below GLD over the same window |
| Diversification utility | Strong in trending regimes, weak in sharp reversals | Conditional, not unconditional |
| Suitability as portfolio core | Poor | Wrong tool for the job |
FAQ
Is DBMF actually an "AI" ETF?
No, in the modern machine-learning sense. The strategy is a rolling multivariate regression on hedge-fund returns to infer factor exposures, then replication of those exposures in liquid futures. It is systematic and rules-based; it is not learning in the way a contemporary ML system does. "Quantitative replication" is a more accurate label than "AI."
How does DBMF differ from a traditional managed-futures fund?
A traditional CTA forms its own trend signals on prices and trades them directly. DBMF does not. It observes what the largest CTAs are doing — inferred from how their reported returns covary with liquid markets — and copies the resulting positioning. The trade-off is a slight lag in exchange for a much lower fee load and daily ETF liquidity.
Why is the distribution yield so high (5.2%)?
The "yield" here is not equity dividend income. Managed-futures ETFs hold large cash balances as collateral for their futures positions; that cash earns the prevailing short-term rate. With the Fed funds rate at 3.64% and the 10-year Treasury at 4.47% (FRED, as of 2026-05-14), collateral yield is structurally elevated. The distribution will fall meaningfully if short rates fall.
Does DBMF hedge equity drawdowns?
Conditionally, not reliably. In 2022, when equities and bonds fell together and major trends developed in rates and currencies, DBMF was strongly positive. In a sharp single-event equity drawdown without a coincident trend regime, the historical evidence for trend-following hedging is weaker. Treat the diversification benefit as regime-dependent.
What's the tax profile?
DBMF holds futures, so a portion of distributions can fall under Section 1256 mark-to-market rules (60% long-term / 40% short-term capital gains treatment) rather than ordinary dividend treatment. The tax-cost ratio is materially higher than a broad equity index fund. In a taxable account, this matters; in a tax-deferred account, it doesn't. Investors should consult the fund's most recent 19a-1 notices for the actual distribution character.
What this analysis can and can't tell you
DBMF has six years of live track record. That window covers one notable trend-friendly stress (2022) and one trend-hostile mean-reversion period (late 2022 to early 2023), but it does not include a 2008-style credit event, a 2000-style multi-year equity bear market, or a sustained inflationary trend regime of the kind academic backtests rely on for the strongest evidence of managed-futures utility. Any conclusion drawn from a 5-year window on a strategy designed to work across decades should be held provisionally.
The replication model also has not been tested through a regime where the underlying CTA universe collectively underperforms. If the median trend follower loses money, DBMF will too — there is no escape hatch.
Scenarios where DBMF fits — and where it doesn't
- Reader with a fully built equity-and-bond core, looking for a third sleeve: a 5–10% DBMF allocation, alongside or in place of a gold sleeve, is a defensible diversifier. The fee is acceptable for the role.
- Reader early in accumulation with no equity exposure yet: DBMF is the wrong starting point. Build the core first. The diversification benefit of a trend sleeve is meaningful only when there is something to diversify.
- Reader in a high tax bracket investing in a taxable account: the tax-cost ratio meaningfully erodes the post-tax return. Consider holding DBMF preferentially in a tax-deferred sleeve.
- Reader who cannot stomach 18-month drawdowns: the realized -20.4% drawdown with extended recovery is part of the strategy's signature. If that path is not sit-through-able, the position size is too large or the fund is the wrong tool.
Editor's read
DBMF is the most intellectually honest managed-futures product available to a retail investor in an ETF wrapper. It does what it says, charges roughly the right price for what it does, and discloses its methodology in enough detail to be analyzable. The case for owning it is narrow but real: a small, defined sleeve in a portfolio that already has its equity and fixed-income beta sorted out, held with the explicit expectation that the position will sometimes look terrible for a year or more and the investor needs to leave it alone. The case against owning it is mostly that most investors don't actually need a third diversifier and would be better served by spending the 0.85% somewhere with more compounding leverage.
Editor's holdings disclosure: the editor does not hold DBMF or GLD at the time of writing.
Key takeaways
- DBMF is a quantitative replication of the top managed-futures hedge funds, not a forecasting system and not "AI" in any modern sense.
- The 0.85% fee is roughly half of a traditional CTA's all-in cost and 28x a broad index fund — the right comparison depends on what the position is replacing.
- Six years of live data show a strategy that does what trend replication is supposed to do — but six years is not enough to settle the long-horizon question.
- Diversification benefit is conditional on regime; it is not a portfolio insurance product.
- Defensible as a small satellite sleeve. Not defensible as a core holding for any long-horizon investor.
Methodology: Return, volatility, and drawdown figures are computed from yfinance daily adjusted closes for the trailing five years ending 2026-05-16. Expense ratios, AUM, distribution yield, and inception dates are taken from the issuer fact sheets linked in the data table. Macro reference rates (10Y Treasury, Fed funds, VIX, CPI) are from FRED as of 2026-05-14 / 2026-04-01. All percent figures are rounded to one decimal place.
This article is for educational purposes and does not constitute personalized financial advice. See Disclaimer.