
Photo by Oleksandr Brovko on Unsplash
The short version
- BND and AGG charge the identical 0.03% expense ratio, yield within two basis points of each other, and posted max drawdowns within 0.1 percentage points over five years — functionally, they are the same exposure.
- The real differentiator is not performance but the index definition, holdings count, and AUM scale: BND tracks a float-adjusted aggregate and holds more issues; at roughly $394B it is nearly three times AGG's size.
- Bottom line: for most investors the choice should be made on platform availability and tax-lot mechanics, not on a CAGR gap that is statistical noise.
The Vanguard Total Bond Market ETF (BND) and the iShares Core U.S. Aggregate Bond ETF (AGG) are the two default building blocks for the investment-grade bond sleeve of a long-term portfolio. The question readers usually ask — "which one is better?" — quietly assumes there is a meaningful difference to find. The data suggests the more useful question is whether the difference matters at all, and where the small distinctions that do exist actually live.
Context: what "total bond market" actually means
Both funds aim to replicate the U.S. investment-grade taxable bond market: Treasuries, agency mortgage-backed securities, and investment-grade corporates, weighted roughly by market value. BND tracks the Bloomberg U.S. Aggregate Float Adjusted Index; AGG tracks the Bloomberg U.S. Aggregate Bond Index. The "float adjusted" qualifier in BND's benchmark removes bonds held by the Federal Reserve and other official institutions from the index weights — a methodological choice that, in practice, nudges sector weights slightly but does not change the fund's character.
The macro backdrop frames why these funds behaved the way they did. The effective federal funds rate sits at 3.63% (FRED, asof 2026-05-01) and headline CPI is running at 3.9% year over year (FRED, asof 2026-04-01). With both funds yielding roughly 3.9%, the nominal distribution yield is close to the inflation rate — meaning the real yield on a total-bond position is currently near break-even before tax. That is the lens through which the trailing-return numbers should be read.
The data, side by side
| Metric | BND | AGG |
|---|---|---|
| Issuer / fund | Vanguard Total Bond Market | iShares Core U.S. Aggregate |
| Expense ratio | 0.03% | 0.03% |
| AUM | $394.4B | $136.5B |
| Distribution yield | 3.9% | 4.0% |
| Inception | 2001-11-12 | 2003-09-22 |
| NAV | $72.82 | $98.19 |
| 5Y CAGR | 0.1% | 0.1% |
| 10Y CAGR | 1.7% | 1.6% |
| 5Y annualized volatility | 6.0% | 6.1% |
| 5Y max drawdown | -17.9% | -17.8% |
Data: yfinance, fetched 2026-06-09. Expense ratio, AUM, and inception cross-checked against issuer fact sheets — Vanguard BND profile and iShares AGG profile.
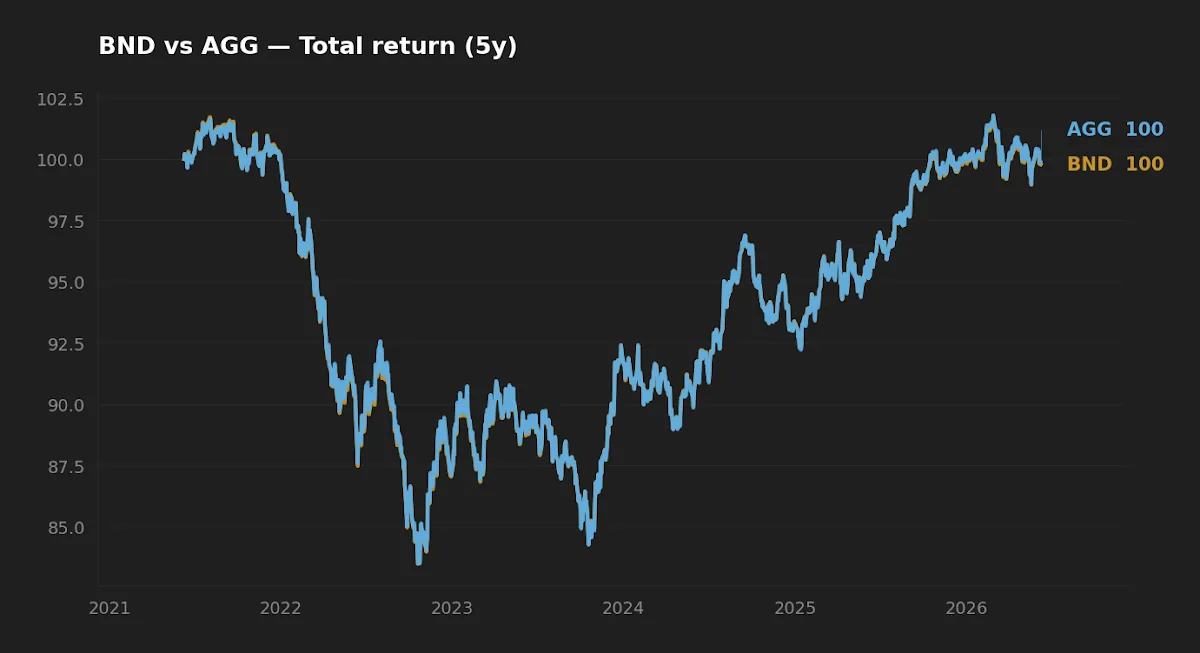
The normalized total-return chart is the clearest summary of the whole comparison: two lines that are, for practical purposes, one line. Where they diverge by a few tenths of a percent, the gap is well inside the range you would expect from differences in distribution timing and the daily NAV-versus-price noise that yfinance picks up.
Cost and yield: a gap that isn't one
Both funds carry a 0.03% expense ratio. That is not "close" — it is identical, and it is about as low as a broad bond fund gets. The distribution yields, 3.9% for BND and 4.0% for AGG, differ by two basis points, which is within the rounding noise of how each fund times and smooths its monthly payouts. There is no durable yield advantage to harvest here.
This is worth stating plainly because the marketing instinct in retail content is to manufacture a winner. Faithfulness in small things means recognizing when the small thing is genuinely zero. A two-basis-point yield difference will be swamped by your own reinvestment timing, by the bid-ask spread you pay on entry, and — for taxable accounts — by the ordinary-income treatment of bond coupon distributions, which is the same for both funds.
When two funds share the same expense ratio, the same yield to within two basis points, and drawdowns that differ by a tenth of a percent, the decision has already left the realm of performance and become a question of plumbing.
Realized risk: the 2022 lesson is baked in
The single most important number in the table is the one investors least associate with bonds: a five-year maximum drawdown of -17.9% for BND and -17.8% for AGG. This is the 2022 rate shock made concrete. When the Federal Reserve raised rates faster than at any point in four decades, the duration embedded in an aggregate bond fund — roughly six years — translated directly into price declines that rivaled a moderate equity correction. The near-identical drawdowns confirm that both funds carry essentially the same interest-rate sensitivity, which is the dominant risk factor in investment-grade bonds.
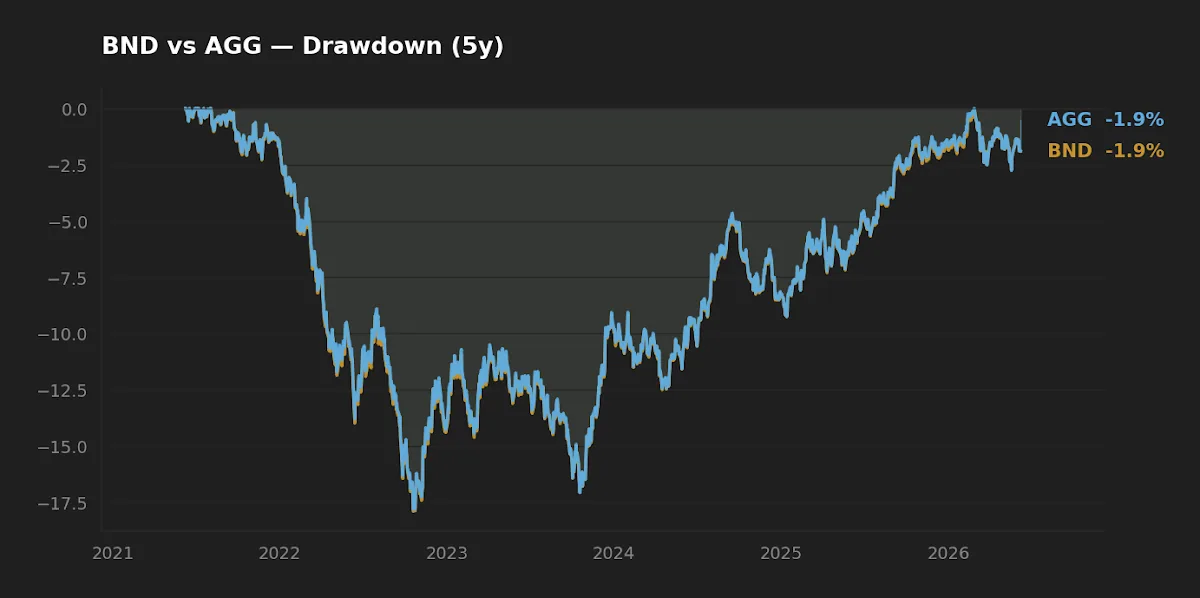
The 5Y CAGR of roughly 0.1% for both funds is not a sign of a broken asset class — it is the recovery period from that drawdown still being incomplete in total-return terms. The 10Y CAGR of 1.6–1.7% is the more honest long-horizon read, and even that is below current inflation. The lesson is not "avoid bonds"; it is that the total-bond sleeve earns its place through diversification behavior and capital stability in equity stress, not through standalone return. Investors thinking about how a fixed-income floor interacts with the rest of a portfolio may find the discussion in SGOV's role in a long-term portfolio a useful companion, since ultra-short Treasuries carry almost none of this duration risk.
The non-obvious differentiator: index breadth and scale
If performance, cost, and risk are effectively tied, what actually separates these funds? Two things, and neither shows up in a return chart.
First, holdings breadth. BND's float-adjusted index methodology and Vanguard's sampling approach result in the fund holding a larger number of individual bonds than AGG. More positions means marginally finer replication of the underlying market and slightly less idiosyncratic sampling error — a second-order effect, but a real one for a fund whose entire job is to be the market rather than beat it.
Second, scale changes behavior. BND's roughly $394B in assets versus AGG's $136B is not a vanity metric. In fixed income, where many underlying bonds trade infrequently, larger AUM and higher on-screen ETF liquidity tend to support tighter bid-ask spreads and more efficient creation/redemption. For a buy-and-hold investor making infrequent, sized purchases, this is minor. For anyone rebalancing larger positions or trading in less liquid conditions, the spread is a real implementation cost that quietly favors the larger fund. This is the kind of friction that compounds invisibly — the opposite of the headline expense ratio, which everyone sees.
The flip side of breadth is closure and concentration risk, and here both funds are about as safe as ETFs get: two of the largest fixed-income funds in existence, from two of the most established issuers, with decades of operating history. Neither carries meaningful closure risk. Readers comparing the passive aggregate approach against newer active alternatives may find the contrast in AGG vs. BNDI instructive — it isolates what you give up, and pay for, when you leave the index.
Winner by category
| Category | Edge | Why |
|---|---|---|
| Cost | Tie | Both 0.03%. |
| Realized risk | Tie | -17.9% vs -17.8% max drawdown; 6.0% vs 6.1% volatility. |
| Realized return | Tie | 5Y and 10Y CAGR differ by ~1–10 bp — inside the noise. |
| Suitability / implementation | BND (slight) | Broader holdings and larger AUM support tighter spreads; otherwise platform-dependent. |
FAQ
Is BND or AGG better for a long-term portfolio? On the data, neither has a durable advantage: identical 0.03% expense ratios, yields within two basis points, and five-year drawdowns within 0.1 percentage points. The practical tiebreakers are which fund trades commission-free on your platform and, for larger trades, BND's slightly tighter spreads from its larger asset base.
Why did these "safe" bond funds fall nearly 18%? The -17.9% (BND) and -17.8% (AGG) five-year drawdowns reflect the 2022 interest-rate shock. Aggregate bond funds carry roughly six years of duration, so a rapid rise in rates produces equity-like price declines. The drawdown is a duration story, not a credit-quality one.
Can I hold both BND and AGG for diversification? There is little diversification benefit, since the funds track nearly the same index and behave almost identically. Holding both mainly adds bookkeeping. One concrete reason some investors do is tax-loss harvesting — selling one at a loss and buying the other to maintain exposure without a wash sale, given they are not "substantially identical" in the strict sense. Confirm the treatment with a tax professional.
How does the yield compare to cash or Treasuries? Both funds yield roughly 3.9–4.0%, against an effective fed funds rate of 3.63% (FRED, asof 2026-05-01) and CPI of 3.9% (FRED, asof 2026-04-01). The real yield is near break-even, and unlike cash, these funds carry duration risk — they can lose principal if rates rise.
Which has lower trading costs? BND's larger AUM and higher trading volume generally support tighter bid-ask spreads, a modest edge for larger or more frequent trades. For small, infrequent buy-and-hold purchases the difference is negligible.
What this comparison can and can't tell you
The return and risk figures here cover a five- and ten-year window dominated by a single, unusual macro regime: zero rates, then the fastest tightening cycle in forty years. That means the drawdown and CAGR numbers are heavily shaped by one event. The data cannot tell you how these funds will behave in a sustained disinflation, a credit-stress episode, or a prolonged sideways-rate environment — none of which the recent window stress-tested. It also cannot capture your personal bid-ask spread, your platform's commission structure, or your tax situation, all of which can matter more than any difference between the two funds. Treat the numbers as a description of what happened, not a forecast.
Scenarios where each fund fits
Reader in their 30s, 401(k)-only, building a first bond sleeve: hold whichever the plan offers commission-free. The choice is genuinely a coin flip; do not overthink it.
Reader nearing retirement, sizing a larger fixed-income allocation in a taxable brokerage: BND's deeper liquidity and broader holdings give a marginal implementation edge for larger lots. The duration risk shown in the drawdown chart is the variable to weigh against shorter-duration alternatives — a question the re-evaluation of the 4% rule takes up directly.
Reader who already holds one and is tempted to switch: there is no data-supported reason to incur a taxable event to move between two near-identical funds. Stay put unless you are harvesting a loss.
Editor's read
If forced to pick one for a long-term core bond sleeve, the editor leans marginally toward BND — not for any return or yield reason, since those are a tie, but because the broader holdings base and the larger AUM produce slightly tighter implementation friction over decades of contributions and rebalancing. That is a thin edge, and it is dwarfed by the duration decision itself: whether an aggregate bond fund, with its ~18% historical drawdown, is the right shape of fixed income for a given horizon at all. Between BND and AGG specifically, the honest answer is that platform availability should decide it.
The editor holds neither BND nor AGG at the time of writing.
Methodology: Price and return figures (CAGR, volatility, max drawdown, NAV, yield) from yfinance, pulled 2026-06-09, computed over trailing five- and ten-year windows. Expense ratio, AUM, and inception date cross-checked against issuer fact sheets (Vanguard, iShares). Macro figures from FRED: effective federal funds rate asof 2026-05-01, CPI year-over-year asof 2026-04-01. Total-return and drawdown charts generated from the same price series.
This article is for educational purposes and does not constitute personalized financial advice. See our Disclaimer.