
Photo by Laura Chouette on Unsplash
The short version
- MOAT and QUAL both sell "quality," but they reach it by opposite routes: MOAT is a concentrated, valuation-sensitive selection of wide-moat businesses; QUAL is a broad, market-cap-weighted screen on profitability and balance-sheet stability.
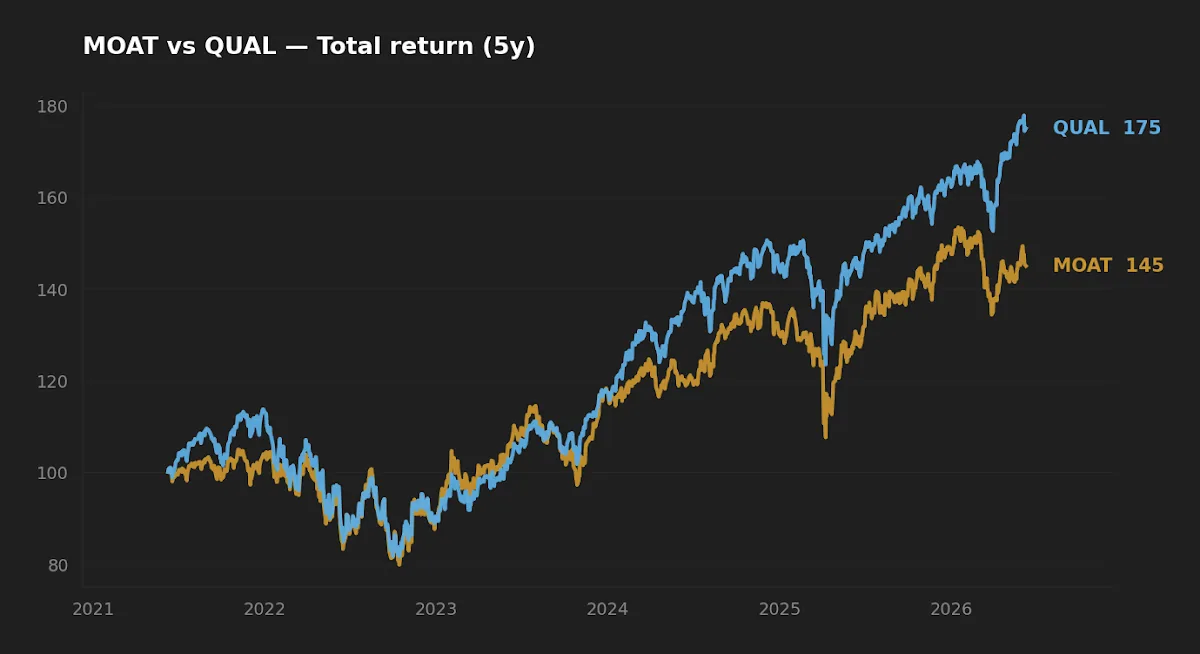
- Over the trailing five years QUAL compounded faster (11.9% vs 8.0% CAGR) at slightly lower volatility — yet MOAT held a shallower maximum drawdown (−24.0% vs −28.2%), an asymmetry the headline return hides.
- Bottom line: QUAL is the lower-cost, more scalable core holding; MOAT is a higher-conviction, higher-turnover satellite whose valuation discipline behaves differently in a drawdown.
"Quality" is one of the most overloaded words in factor investing. Two funds can both claim it, hold a partly overlapping roster of profitable American companies, and still produce meaningfully different returns over a decade. MOAT and QUAL are the cleanest illustration of that divergence I know — and the central question of this article is whether "wide-moat selection" and "the quality factor" are two labels for the same thing, or two genuinely different bets.
They are different bets, and the difference matters more than the shared label suggests. The data below shows where, and the more interesting finding is in the part the trailing return number quietly omits.
Context: two definitions of quality
The VanEck Morningstar Wide Moat ETF (MOAT) tracks an index built from Morningstar's equity analyst ratings. The universe is companies the analysts judge to have a wide economic moat — a durable structural advantage (network effects, switching costs, intangible assets, cost advantage, efficient scale) expected to persist for two decades or more. Crucially, the index then applies a valuation overlay: among the wide-moat names, it favors those trading cheaply relative to Morningstar's fair-value estimate, and reconstitutes on a staggered quarterly schedule. The result is a concentrated portfolio — roughly 50 equally weighted positions — with a built-in contrarian, value-leaning tilt.
The iShares MSCI USA Quality Factor ETF (QUAL) is a different animal. It scores large- and mid-cap US stocks on three fundamentals — high return on equity, stable year-over-year earnings growth, and low financial leverage — then weights the survivors by market capitalization within each sector. There is no valuation gate. The portfolio holds several hundred names and, because it is cap-weighted, tends to concentrate in the largest, most profitable companies in the index. In practice that means heavy exposure to mega-cap technology, which is where balance-sheet quality and scale currently coincide. This is the same passive, rules-based factor machinery covered in the broader academic case for factor investing.
So one fund buys quality and tries to buy it cheaply; the other buys quality wherever the market has already concentrated it. That single design choice — the valuation overlay — drives almost everything that follows.
The data
| Metric | MOAT | QUAL |
|---|---|---|
| Name | VanEck Morningstar Wide Moat | iShares MSCI USA Quality Factor |
| Expense ratio | 0.46% | 0.15% |
| AUM | $11.8B | $47.1B |
| Inception | 2012-04-24 | 2013-07-16 |
| Dividend yield | 1.4% | 0.9% |
| 5Y CAGR | 8.0% | 11.9% |
| 10Y CAGR | 13.2% | 14.2% |
| 5Y volatility (ann.) | 18.2% | 17.3% |
| 5Y max drawdown | −24.0% | −28.2% |
Price, return, volatility and drawdown figures are from yfinance, pulled 2026-06-08; expense ratio, AUM, yield and inception are from the issuer fact sheets (VanEck MOAT; iShares QUAL). All returns are price/total-return series; treat the five-year window as a single regime, not a law.
Why QUAL pulled ahead — and what it cost
The five-year gap is wide: 11.9% versus 8.0% annualized, a spread of nearly four points per year that compounds into a large terminal difference. The proximate cause is exposure. Over this particular window, market-cap-weighted quality routed capital into the handful of mega-cap technology names that drove most of the index's return. QUAL rode them by construction. MOAT, with its fair-value overlay, repeatedly trimmed or avoided those same names as they grew expensive, rotating instead toward cheaper wide-moat businesses in healthcare, industrials and consumer staples that lagged.
This is the part worth sitting with. MOAT did not underperform because its companies were lower quality — by the moat definition they are arguably higher quality. It underperformed because its valuation discipline steered it away from the most expensive part of the market during a period when expensive kept getting more expensive. That is precisely what a value-tilted strategy is supposed to do, and precisely when it is supposed to hurt. The same dynamic of factor exposure drifting toward concentration over time is something I traced directly in a study of how QUAL and its factor cousins drift.
Note the ten-year numbers compress the gap considerably — 13.2% for MOAT against 14.2% for QUAL. A longer window that includes a different leadership regime narrows the difference to a single point. The five-year spread is real, but it is partly a story about which regime you happened to measure.
MOAT did not lag because its companies were lower quality; it lagged because its valuation discipline steered it away from the most expensive part of the market — exactly when expensive kept winning.
Realized risk: the asymmetry the CAGR hides
Here is the non-obvious result. QUAL won on return and even edged MOAT on annualized volatility (17.3% vs 18.2%). On those two numbers alone you would conclude QUAL is the lower-risk fund. But the realized maximum drawdown reverses the ranking: MOAT bottomed at −24.0% over the five years, while QUAL fell −28.2%.
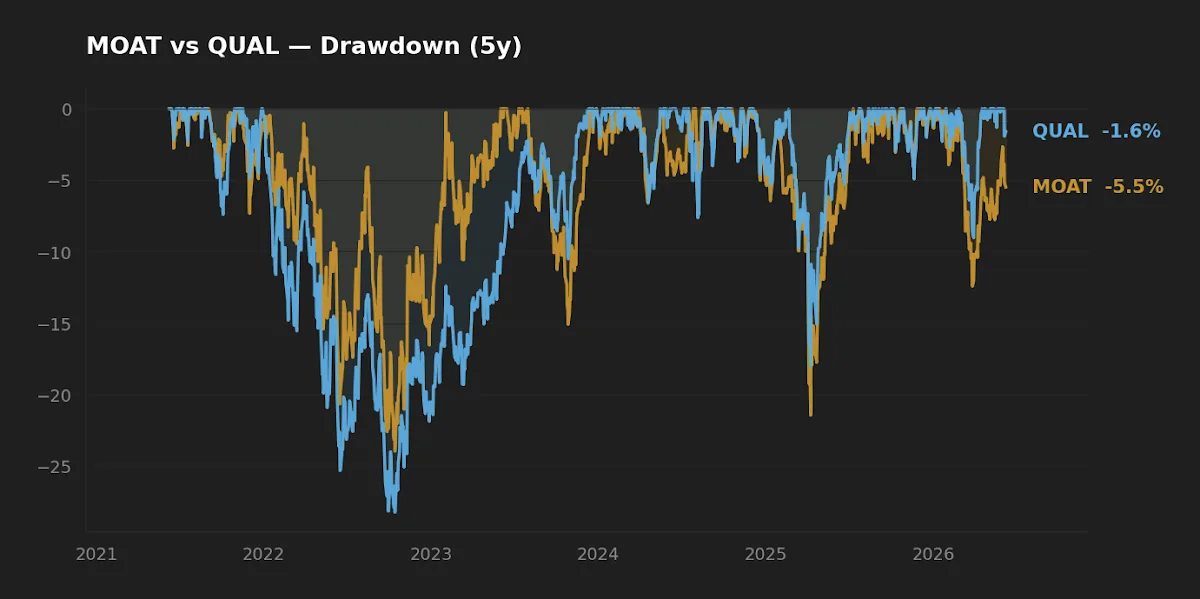
Volatility and drawdown are not the same risk. Volatility is a symmetric, day-to-day measure; maximum drawdown is the single worst peak-to-trough loss an investor would actually have lived through. MOAT's valuation tilt and sector diversification cushioned its deepest fall, even though its day-to-day path was choppier. QUAL's concentration in a narrow band of mega-caps — the source of its return — was also the source of a deeper trough when that same band sold off.
This is the asymmetry I'd want a reader to take away: the fund that compounded faster also fell harder at its worst moment. Whether that trade is worth it depends entirely on whether you are accumulating through the drawdown or drawing income from it — the distinction at the heart of sequence-of-returns risk. Initially I assumed the higher-volatility fund would also own the deeper drawdown. The realized data said otherwise, and the reason is structural, not noise.
Cost, turnover, and the friction that does not show in CAGR
The expense ratios differ by 0.31% — 0.46% for MOAT against 0.15% for QUAL. On a multi-decade horizon that gap is unforgiving; basis points compound in the wrong direction just as reliably as returns compound in the right one. But the headline fee understates MOAT's true friction.
MOAT's staggered quarterly reconstitution and valuation overlay generate high portfolio turnover — the index deliberately sells appreciated names and buys cheaper ones. Turnover has two costs that never appear in the expense ratio: realized capital-gains distributions (a real tax-cost ratio drag in a taxable account) and transaction costs inside the fund. QUAL, cap-weighted and rebalanced semi-annually, lets winners run and turns over far less, which tends to make it more tax-efficient in a taxable wrapper. For an investor holding in a tax-advantaged account, this matters less; in a brokerage account, it can quietly widen the 0.31% headline gap.
On capacity, QUAL's $47.1B sits comfortably in liquid mega-caps. MOAT's $11.8B in a concentrated, higher-turnover, more valuation-sensitive book is still well within capacity, but it is the kind of strategy where AUM growth and turnover interact — something worth watching rather than worrying about today.
Scoreboard
| Category | Winner | Why |
|---|---|---|
| Cost | QUAL | 0.15% vs 0.46%, plus lower turnover and better tax efficiency |
| Realized return (5Y) | QUAL | 11.9% vs 8.0% CAGR over this window |
| Realized risk (drawdown) | MOAT | −24.0% vs −28.2% worst peak-to-trough |
| Suitability as a core | QUAL | Broad, cheap, scalable, tax-efficient |
FAQ
Is MOAT just a more expensive version of QUAL? No. They define quality differently. MOAT selects ~50 wide-moat businesses and applies a fair-value overlay, giving it a concentrated, value-leaning profile. QUAL screens several hundred names on profitability and leverage, then cap-weights them, concentrating in mega-caps. Their holdings overlap only partially.
Why did MOAT underperform if its companies have stronger moats? Over the past five years its valuation discipline rotated it away from the expensive mega-caps that drove QUAL's return. Strong businesses bought at restrained valuations can still lag during a regime that rewards momentum and concentration.
Which is more tax-efficient? Generally QUAL, because its low turnover produces fewer taxable distributions. MOAT's high-turnover reconstitution can generate capital-gains distributions, raising its effective cost in a taxable account.
Does the deeper QUAL drawdown make it riskier? On the realized five-year data, QUAL had the deeper maximum drawdown (−28.2%) despite slightly lower volatility. Whether that matters depends on your horizon and whether you are adding to or withdrawing from the position during a decline.
Can I hold both? Some investors pair them precisely because their quality definitions diverge — QUAL as a low-cost core, MOAT as a valuation-aware satellite. How a position like that fits a broader allocation is the subject of the framework's quarterly review.
What this comparison can and can't tell you
The five-year return, volatility and drawdown figures cover a single, mostly bull-leaning regime dominated by mega-cap technology leadership. That window flatters cap-weighted concentration and penalizes valuation discipline; a regime in which expensive stocks de-rate would likely reverse much of the ranking, as the narrower ten-year gap hints. These numbers are descriptive, not predictive. They contain no forward stress test, no factor-attribution regression, and no isolation of the valuation overlay's contribution — they tell you what happened, not what must happen next.
Scenarios where each fund fits
- Reader in their 30s, 401(k)-only, wants one quality sleeve: QUAL's lower cost and broad, scalable construction make it the simpler default core. Tax efficiency is moot inside the wrapper, so the decision rests on cost and breadth.
- Taxable-account investor sensitive to distributions: QUAL's lower turnover is the friendlier profile; MOAT's reconstitution can surface unwanted gains.
- Investor who already owns mega-cap-heavy index funds: MOAT's valuation tilt and sector spread add genuine diversification rather than doubling down on the same names a total-market or QUAL position already holds.
Editor's read
If forced to pick one for the long-horizon core, the editor leans toward QUAL: the 0.31% fee gap, lower turnover and better tax behavior compound quietly in its favor over decades, and its construction is simple enough to hold through a bad year without second-guessing. MOAT is the more intellectually interesting fund — its shallower drawdown and built-in valuation discipline are real features — but it reads as a higher-conviction satellite, not a default core. The five-year return gap is partly a regime artifact; I would not extrapolate it.
The editor holds neither MOAT nor QUAL at the time of writing.
Key takeaways:
- MOAT and QUAL define "quality" differently — concentrated valuation-aware moat selection versus broad cap-weighted profitability screening — and that design choice, not the shared label, drives their divergence.
- QUAL led on five-year return (11.9% vs 8.0%) and edged volatility, but MOAT held the shallower maximum drawdown (−24.0% vs −28.2%) — return and worst-case loss ranked the funds oppositely.
- The 0.31% fee gap understates MOAT's true friction once high turnover and distribution drag are counted.
- The ten-year gap (13.2% vs 14.2%) is far narrower than the five-year gap, a reminder that the comparison is regime-dependent.
Methodology: Return, volatility and drawdown computed from yfinance daily price series, pulled 2026-06-08; five- and ten-year windows annualized. Expense ratio, AUM, dividend yield and inception from issuer fact sheets (VanEck, iShares). Macro reference: US fed funds rate 3.63% and CPI 3.9% year-over-year (FRED, asof 2026-05-01 and 2026-04-01) frame a still-restrictive, disinflating backdrop in which quality factors have historically held up relatively well — context only, not a forecast.
This article is for educational purposes and does not constitute personalized financial advice. See our Disclaimer.