
Photo by Dynamic Wang on Unsplash
The short version
- Over the trailing five and ten years, cap-weighted VOO beat equal-weighted RSP on total return — and it did so at a lower fee (0.03% vs 0.20%).
- Equal-weighting is not "the same 500 stocks, diversified." It is a persistent small/mid-cap size tilt plus a quarterly contrarian rebalance, and that tilt has been on the wrong side of a mega-cap-led market.
- Bottom line: RSP is a deliberate factor bet against concentration, not a safer version of the index — and it should be held only by someone who wants that bet.
The pitch for equal-weighting is intuitive: if you own the S&P 500 by market cap, a handful of mega-caps dominate the portfolio, so why not hold all 500 names in equal size and let breadth do the work? The question that matters for a long-horizon holder is narrower — does that reweighting actually deliver more return, or better return per unit of risk, once fees and the realized market regime are accounted for? The recent data answers cleanly in one direction, but the reason behind the answer is more interesting than the scoreboard.
Context: what equal-weighting actually changes
VOO (Vanguard S&P 500 ETF) holds the index by float-adjusted market capitalization. RSP (Invesco S&P 500 Equal Weight ETF) holds the same constituent list, but every name gets roughly the same weight — about 0.2% each — and Invesco rebalances back to equal weight quarterly. Same universe, different weighting rule.
That single rule change has three consequences that compound. First, RSP structurally underweights the largest companies and overweights the smallest members of the index, so it carries a persistent size tilt toward mid-caps. Second, the quarterly rebalance is mechanically contrarian: it trims whatever has run up and adds to whatever has lagged, an implicit sell-high/buy-low discipline. Third, that same rebalance generates far more turnover than a cap-weighted fund, which almost never has to trade to stay aligned with its benchmark. The size tilt is the dominant effect; the rest are second-order. Understanding RSP as a size-and-anti-concentration factor product — rather than "the diversified S&P" — is the whole analysis.
The data
| Metric | RSP | VOO |
|---|---|---|
| Name | Invesco S&P 500 Equal Weight | Vanguard S&P 500 |
| Expense ratio | 0.20% | 0.03% |
| AUM | $93.7B | $1,670.9B |
| Inception | 2003-04-24 | 2000-11-13 |
| Dividend yield | 1.5% | 1.1% |
| 5Y CAGR | 9.1% | 13.5% |
| 10Y CAGR | 12.1% | 15.5% |
| 5Y volatility (annualized) | 16.2% | 16.9% |
| 5Y max drawdown | −21.4% | −24.5% |
Return, volatility, and drawdown figures are computed from yfinance daily adjusted-close data through 2026-07-15. Expense ratio, AUM, yield, and inception are from the issuer fact sheets: Invesco (RSP) and Vanguard (VOO).
Return: the regime did most of the work
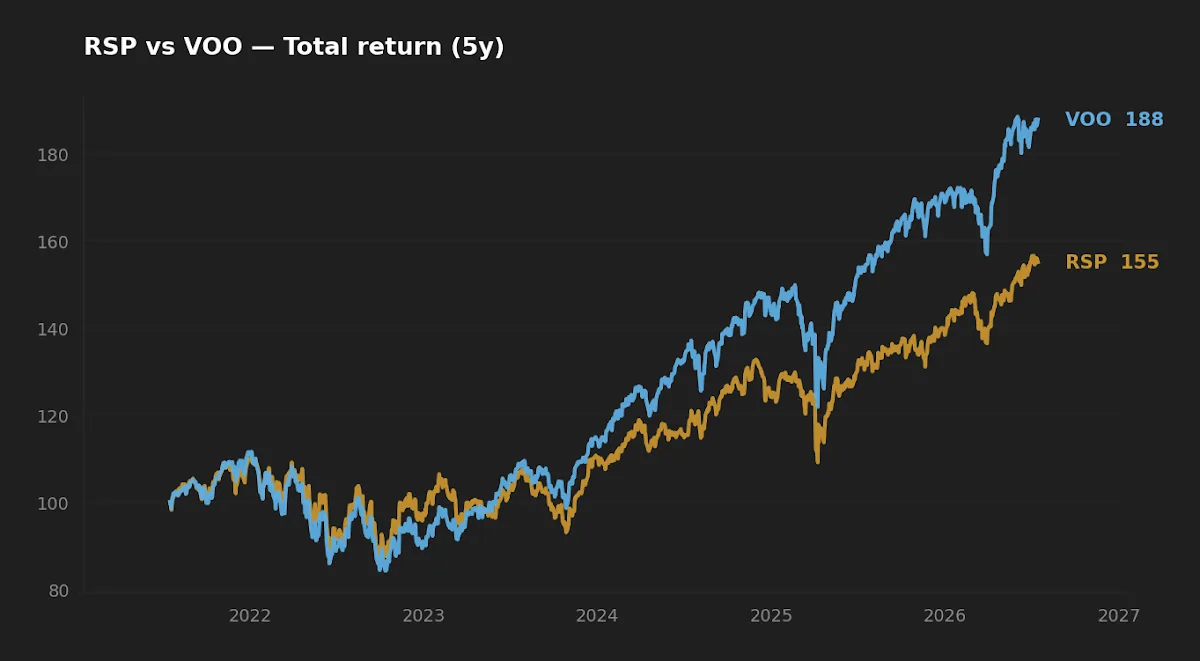
The gap is not subtle. VOO compounded at 13.5% annually over five years versus 9.1% for RSP — a 4.4-percentage-point spread per year — and the ten-year figures (15.5% vs 12.1%) show the same ranking, just narrower. On the normalized total-return chart above, the two lines track closely through the early part of the window and then separate as the market's leadership narrowed into a small group of mega-cap names.
That is the crux. Cap-weighting is, by construction, a momentum-aware structure: winners grow their weight automatically, so a market led by its largest companies flatters the cap-weighted index and penalizes anything that underweights those names. RSP underweights exactly the stocks that drove the last several years of returns. The equal-weight underperformance is not evidence that the strategy is broken — it is evidence that the size and anti-concentration tilts were out of favor. Initially I expected the ten-year number to favor RSP more, given equal-weight's stronger 2003–2015 record; the rolling picture shows how much of that earlier edge has been given back as concentration intensified.
Equal-weighting didn't lose because breadth is a bad idea — it lost because it was structurally short the exact mega-caps that led the market.
This is also why fee alone doesn't explain the gap. The 0.17% expense-ratio difference compounds against RSP, and over decades that drag is real and unforgiving. But 0.17% a year cannot account for a 4.4-point annual return spread. The overwhelming majority of the difference is the factor tilt meeting an unfavorable regime, not costs. That distinction matters, because factor regimes mean-revert while fees never do.
Realized risk: less concentrated, but not obviously safer
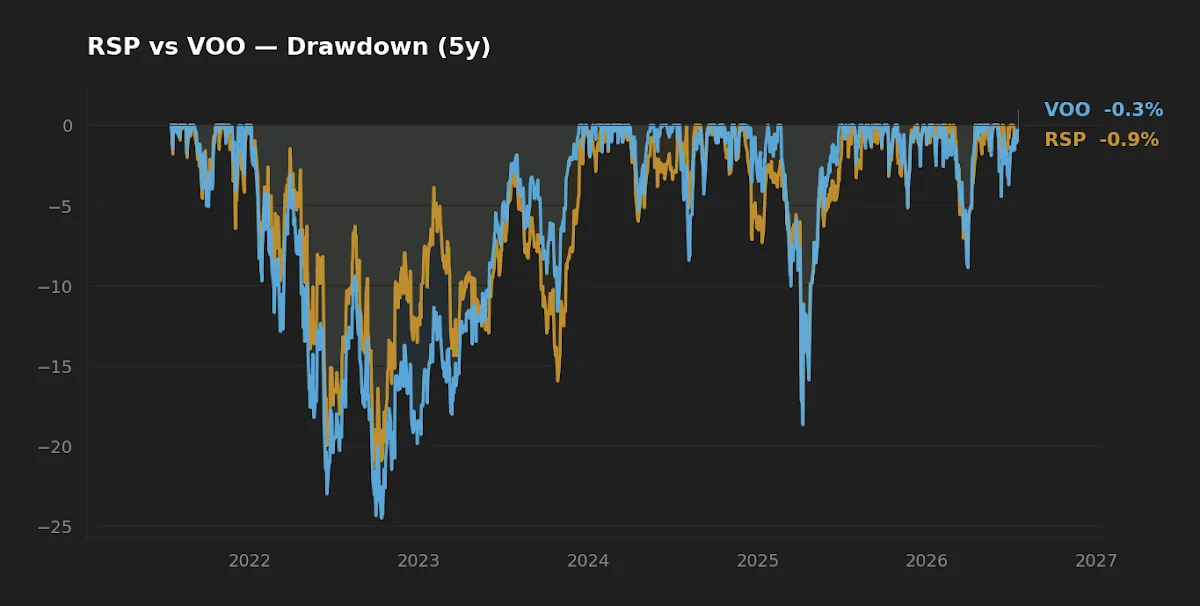
Here the intuition partly holds. RSP's five-year maximum drawdown was −21.4% versus −24.5% for VOO, and its annualized volatility was marginally lower (16.2% vs 16.9%). Spreading weight across 500 names instead of concentrating it in a few does reduce single-stock and single-sector concentration, and in this window that showed up as a slightly shallower worst-case decline.
But shallower drawdown did not translate into better risk-adjusted return. A fund that returns 9.1% with 16.2% volatility has a materially lower return-to-risk ratio than one returning 13.5% with 16.9% volatility. The reduction in drawdown was small; the reduction in return was large. Over this five-year sample, an investor was not compensated for equal-weighting's contrarian structure — they paid for diversification with return and received only a modest cushion in exchange. Whether that trade improves in a broadening market is the open question, and the drawdown chart cannot answer it because it only covers one regime.
Worth noting on the income side: RSP's 1.5% yield edges VOO's 1.1%, a byproduct of the mid-cap tilt. But with the 10-year Treasury at 4.58% (FRED, asof 2026-07-14), neither yield is competitive as an income source — both funds are total-return vehicles, and framing either as a dividend play misreads what they are.
Implementation friction and the concentration question
Two practical points separate these funds beyond the headline numbers. First, turnover. RSP's quarterly rebalance generates trading that a cap-weighted fund avoids entirely, which can raise the tax-cost ratio in a taxable account relative to VOO's near-zero-turnover structure. In a tax-advantaged account this matters less. Second, capacity and cost of ownership: both funds are large and liquid — $93.7B and $1.67T in AUM — so bid-ask spreads and closure risk are non-issues for either. The friction that remains is the fee and the tax drag, and both favor VOO.
The deeper question RSP raises is about concentration risk in the cap-weighted index itself. With the VIX at 16.5 (FRED, asof 2026-07-14), the market is in a calm regime, and calm regimes are exactly when concentration builds quietly. An investor's honest reason to hold RSP is not "it has beaten VOO" — it hasn't — but "I want deliberate exposure away from the largest names in case leadership broadens or mean-reverts." That is a defensible thesis. It is also a bet, and it should be sized and named as one. If you already hold a broad-market fund, some of the equal-weight logic overlaps; the VOO vs VTI comparison and the piece on measuring ETF overlap are useful for checking how much of that tilt you already own. For the underlying "does yield beat total return" instinct that draws some readers to RSP, the SCHD vs VOO analysis covers similar ground.
Scoreboard
| Category | Winner | Why |
|---|---|---|
| Cost | VOO | 0.03% vs 0.20%; lower turnover, lower tax drag |
| Realized return (5Y & 10Y) | VOO | 13.5% vs 9.1% (5Y); 15.5% vs 12.1% (10Y) |
| Realized risk | RSP (narrowly) | −21.4% vs −24.5% drawdown; slightly lower volatility |
| Risk-adjusted return | VOO | Higher return per unit of volatility this window |
| Suitability as a core holding | VOO | Lower cost, broad exposure, no active regime bet |
FAQ
Is RSP more diversified than VOO? By weight distribution, yes — no single name dominates. But diversification of weights is not the same as better outcomes. RSP concentrates its bet in the size factor instead of in mega-caps, so it trades one exposure for another rather than removing risk outright.
Why has equal-weighting underperformed recently? Market leadership narrowed into the largest companies, which cap-weighting captures automatically and equal-weighting underweights by design. The gap is primarily a factor-regime effect, not a fee effect.
Does the 0.20% expense ratio explain RSP's lower return? No. The 0.17% fee gap compounds against RSP and matters over decades, but it is far too small to explain a 4.4-percentage-point annual return difference. The tilt did that.
Would RSP outperform if the market broadens? Plausibly. Equal-weighting has historically done better when returns are broad-based rather than concentrated. That is a forward-looking thesis, though — the trailing data cannot confirm it, and single-regime samples are exactly where look-ahead bias hides.
Which is better for a taxable account? On tax friction alone, VOO — its near-zero turnover produces a lower tax-cost ratio than RSP's quarterly rebalancing. In a tax-advantaged account the difference largely disappears.
Key takeaways
- Over five and ten years, cap-weighted VOO out-returned equal-weighted RSP at one-seventh the fee; the ranking is consistent across both windows.
- The return gap is driven by RSP's size and anti-concentration tilts meeting a mega-cap-led market — a regime effect, not primarily a cost effect.
- RSP delivered a slightly shallower drawdown but worse risk-adjusted return; the diversification was paid for in return, not handed out free.
- RSP is a deliberate factor bet against index concentration — legitimate, but it should be sized and named as a satellite tilt, not mistaken for a safer core.
- Both are total-return vehicles; with the 10Y Treasury near 4.6%, neither yield is a meaningful income argument.
Editor's read
For a long-horizon core sleeve, the editor leans toward VOO: the cost advantage is unforgiving over decades, the turnover is lower, and holding it requires no view on when factor leadership will rotate. RSP is genuinely interesting as a small satellite for an investor who wants explicit, sized exposure away from mega-cap concentration — but that is an active timing bet on a regime change, and it belongs in the part of a portfolio reserved for deliberate tilts, not the part meant to compound quietly across cycles.
The editor holds a cap-weighted broad-market position; does not hold RSP at the time of writing.
Methodology: Price, return, volatility, and drawdown figures computed from yfinance daily adjusted-close data, five- and ten-year windows ending 2026-07-15. Expense ratio, AUM, dividend yield, and inception from Invesco and Vanguard issuer fact sheets. Macro figures from FRED (10-year Treasury and VIX asof 2026-07-14). All figures as pulled on the stated dates and subject to revision.
This article is for educational purposes and does not constitute personalized financial advice. See our full Disclaimer.