
Photo by KOBU Agency on Unsplash
The short version
- Over the trailing decade VUG compounded faster (18.1% vs 12.6% 10Y CAGR), but it did so with roughly double the realized volatility and a drawdown more than twice as deep.
- These two funds are not independent bets — they are the two halves of one large-cap index, so owning both in equal weight approximates a broad market fund with an extra rebalancing decision layered on top.
- Bottom line: VUG rewards a long horizon and a strong stomach; VTV rewards a shorter recovery path and a higher, more tax-relevant dividend. The choice is about the return path you can actually hold, not the endpoint alone.
The value-versus-growth argument is one of the oldest in equity investing, and Vanguard has packaged both sides at the same three-basis-point price. VTV and VUG carve the large-cap US market into two style halves. The central question is not which style is "better" in the abstract — it is what each return path costs you in volatility, in drawdown recovery, and in tax drag, and which of those paths you can actually sit through for decades.
Context: what these two funds actually divide
Both funds launched the same day — 13 November 2000 — and both track CRSP style indices that split the CRSP US Large Cap universe into value and growth halves. The split is driven by factor scores: value uses book-to-price, forward and trailing earnings-to-price, dividend yield, and sales-to-price; growth uses earnings and sales growth rates, plus return on assets. A stock's style membership is not permanent. CRSP reconstitutes the indices on a schedule and uses buffer zones to reduce turnover, but a company can and does migrate from one bucket to the other as its fundamentals shift. That single fact — that "value" is a moving membership, not a fixed list — matters more than most comparisons acknowledge, and I'll come back to it.
Because the two indices are complementary halves of the same parent universe, holding VTV and VUG in market-cap proportion reconstructs something close to a large-cap blend fund. This is the structural point that reframes the whole comparison: these are not two rival products so much as two slices you can weight. If you already hold a broad fund like VOO or VTI, you own both of these styles already — tilting means deliberately overweighting one slice relative to the market's own weighting.
The data
| Metric | VTV | VUG |
|---|---|---|
| Name | Vanguard Value Index ETF | Vanguard Growth Index ETF |
| Expense ratio | 0.03% | 0.03% |
| AUM | $254.5B | $379.2B |
| Inception | 2000-11-13 | 2000-11-13 |
| Dividend yield | 1.9% | 0.4% |
| 5Y CAGR | 12.4% | 13.2% |
| 10Y CAGR | 12.6% | 18.1% |
| 5Y volatility (annualized) | 13.9% | 22.4% |
| 5Y max drawdown | -17.0% | -35.6% |
Expense ratio and AUM are from the Vanguard issuer profile pages (VTV, VUG); price-derived figures (CAGR, volatility, drawdown, yield) are computed from yfinance adjusted-close data pulled 2026-07-15. Both funds are enormous and deeply liquid, so bid-ask spread and closure risk are non-issues here — a rare case where implementation friction is genuinely negligible on both sides.
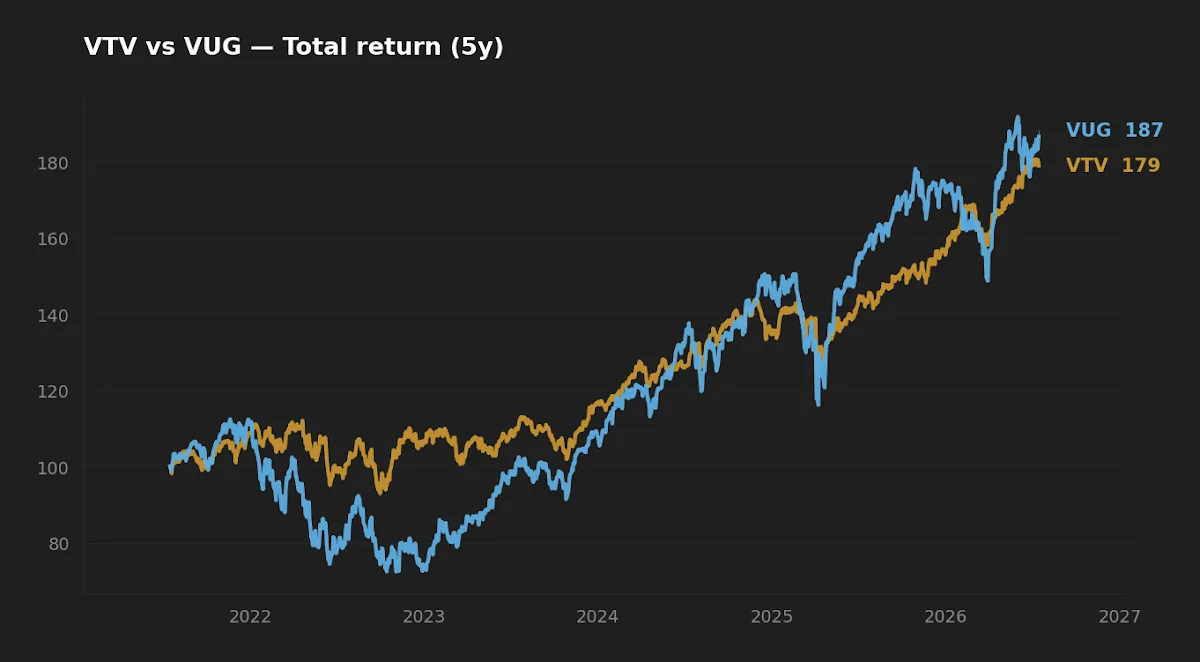
The return gap is real — but the window flatters growth
The most striking number in the table is the 10-year spread: 18.1% versus 12.6%, a 5.5-percentage-point annual gap that compounds into an enormous terminal difference. But notice how it collapses over the trailing five years — 13.2% versus 12.4%, a gap of less than one point. That compression is the single most important thing the data is telling us, and it is easy to miss.
The 10-year window captures a period in which large-cap growth — mega-cap technology and, latterly, anything adjacent to AI — delivered one of the strongest style runs in market history. The trailing five-year figure, which overlaps the 2022 rate-shock drawdown and the subsequent recovery, shows the two styles converging. A single-regime backtest is a genuine hazard here: the decade-long growth premium is not a constant of nature, it is the fingerprint of a specific low-rate, disinflationary, technology-led regime. With the 10-year Treasury at 4.58% (FRED, asof 2026-07-14) and CPI still running near 3.7% year-over-year (FRED, asof 2026-06-01), the discount-rate tailwind that lifted long-duration growth equities for a decade is no longer obviously present.
The decade-long growth premium is not a constant of nature — it is the fingerprint of a specific low-rate, disinflationary regime, and the trailing five-year data already shows the two styles converging.
Initially I read the 10-year gap as decisive. Then I looked at the five-year overlap and the volatility figures together, and the story changed from "growth wins" to "growth was paid a large premium for a specific regime, and that premium is being repriced in real time." The honest reading is that the endpoint favored growth; the path is telling a more balanced story.
Realized risk: the drawdown asymmetry is the whole argument
VUG's five-year annualized volatility of 22.4% against VTV's 13.9% is not a rounding difference — it is a structurally different experience. The drawdown figures make it concrete: VUG fell 35.6% at its worst over the period, more than double VTV's 17.0%. Growth indices concentrate in fewer, higher-multiple, longer-duration names, so they are more sensitive to changes in the discount rate and to sentiment shifts. Value's lower multiples and higher dividend contribution cushion the fall.
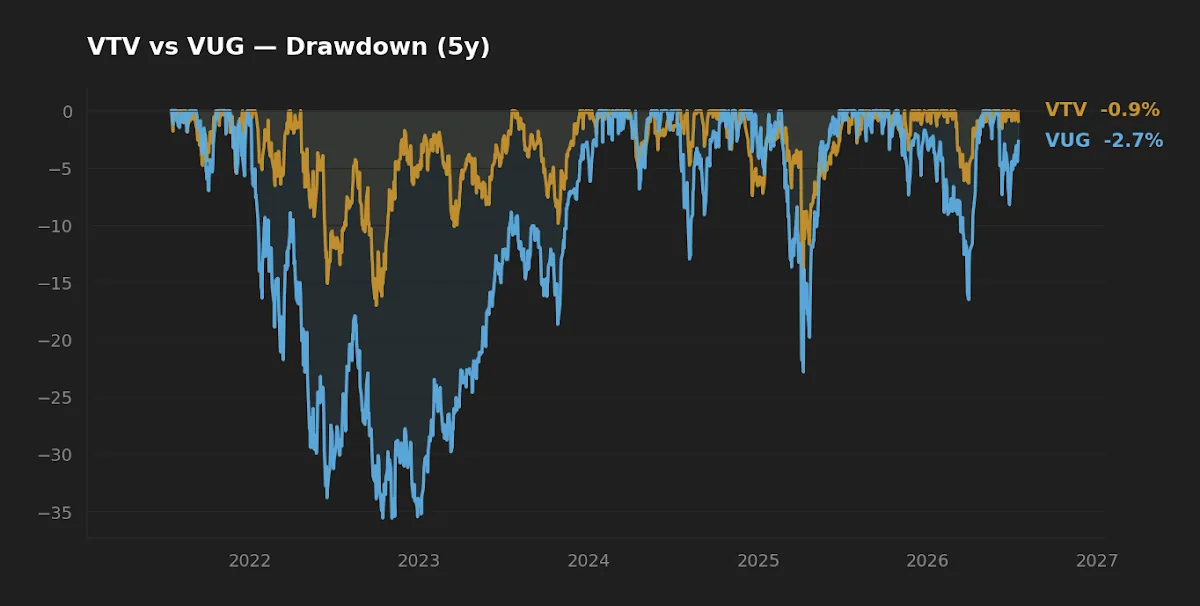
The reason drawdown matters more than volatility is the recovery arithmetic. A 35.6% decline requires a 55% gain to get back to even; a 17.0% decline requires a 20% gain. That asymmetry is unforgiving, and it interacts badly with behavior: the deeper the hole, the more likely an investor sells near the bottom and never captures the recovery. I've written before about the arithmetic of a -30% drawdown — the same math applies here, and it is why the drawdown column, not the CAGR column, is where I'd start the decision.
The dividend and tax dimension
VTV yields 1.9% against VUG's 0.4% — a gap that is not merely cosmetic. Value funds distribute meaningfully more income, and in a taxable account that income is taxed annually whether you want it or not. VUG's near-zero yield means more of its return arrives as unrealized capital appreciation, which you control the timing of. For a taxable investor in a high bracket, that difference in the qualified-dividend split is a real, if modest, after-tax edge for growth; for a tax-advantaged account it is irrelevant. Context matters: at a 4.58% 10-year Treasury yield (FRED, asof 2026-07-14), neither equity fund is competitive as an income vehicle — the dividend here is a total-return and tax-location consideration, not a reason to reach for yield.
The migration point most comparisons miss
Return to the fact that style membership is not fixed. Because CRSP reconstitutes the value and growth indices periodically, a stock that re-rates upward can graduate from VTV into VUG, and a former growth darling whose multiple compresses can fall into VTV. This produces a subtle, non-obvious effect: VTV is not a static "cheap stocks" portfolio — it is a rules-based process that continually sells what has become expensive and buys what has become cheap, at the index level. That embedded discipline is a form of systematic mean-reversion exposure. It is also why the two funds are not perfectly diversifying against each other over long horizons: the same company can appear in both across time, and the boundary between them is redrawn by rules, not by any economic law about what "value" is.
VTV is not a static basket of cheap stocks — it is a rules-based process that continually sells what has grown expensive and buys what has grown cheap.
For readers weighing growth specifically, the index-construction lens is worth pursuing further; the differences between SCHG and VUG show how much the definition of "growth" varies by provider. And for the value side, the contrast with small-cap value approaches like AVUV and VBR shows that large-cap value is a much milder factor tilt than the academic value premium implies.
Scoreboard
| Category | Winner | Why |
|---|---|---|
| Cost | Tie | Both 0.03%; no meaningful difference. |
| Realized return (10Y) | VUG | 18.1% vs 12.6% CAGR over a growth-favoring decade. |
| Realized risk | VTV | Half the drawdown (-17.0% vs -35.6%), lower volatility. |
| After-tax efficiency (taxable) | VUG | 0.4% yield defers more return to controllable capital gains. |
| Suitability for a nervous or near-retirement holder | VTV | Shallower recovery path, higher income cushion. |
What this comparison can and can't tell you
The return figures cover five and ten years — one broad regime dominated by a historic large-cap growth run. That is a single-regime sample, and it is the central limitation. The data cannot tell you whether the next decade rewards value's discipline or growth's concentration; the trailing five-year convergence is a hint, not a forecast. Nor does a maximum-drawdown figure capture the full distribution of stress — it is one point, the worst point, and says nothing about how often smaller drawdowns occurred or how long recovery took. Treat every CAGR here as a description of what happened, not a projection of what will.
Scenarios where each fund fits
Reader in their 30s, 401(k)-only, 25-plus-year horizon, no immediate need for the money → the drawdown asymmetry matters far less because there is time to recover, and the tax question is moot in a sheltered account. A growth tilt via VUG is defensible for someone who can genuinely ignore a -35% year.
Reader within a decade of drawing on the portfolio, or one who knows from experience they sell in panics → VTV's shallower recovery path and income cushion are the more honest fit. The lower endpoint is the price of a path you can actually hold.
Reader who already owns a broad market fund → you hold both styles already. Adding either one is a deliberate tilt, not a diversification move — size it as the satellite it is.
Editor's read
If forced to hold only one in a long-horizon core, the editor leans slightly toward VTV — not because value is destined to outperform, but because the drawdown asymmetry is the risk most likely to break an investor's discipline, and a 17% worst case is one I can sit through where a 36% one tests anyone. The growth premium of the last decade was real but regime-dependent, and with rates and inflation both elevated the tailwind is no longer a given. For an investor with a genuinely long horizon and a proven tolerance for volatility, VUG remains entirely reasonable as a tilt. This is a preference with a stated reason, not a verdict.
Holdings disclosure: the editor holds broad-market and value-tilted exposure that overlaps VTV's constituents; the editor does not hold VUG directly at the time of writing.
FAQ
Is holding both VTV and VUG the same as holding an S&P 500 fund?
Close, but not identical. Together they approximate the large-cap blend of their parent CRSP universe, which differs modestly from the S&P 500 in constituents and weighting. Equal-weighting the two also overweights value relative to the market's own cap weighting, since growth currently carries the larger market value.
Why did VUG outperform so much over ten years but barely over five?
The 10-year window captures a historic low-rate, technology-led growth run; the five-year window includes the 2022 rate shock and recovery, during which the two styles converged (13.2% vs 12.4% CAGR). The gap is regime-dependent, not structural.
Which is more tax-efficient in a taxable account?
VUG, marginally. Its 0.4% yield versus VTV's 1.9% means less is taxed as annual distributions and more accrues as capital appreciation you control the timing of. In a tax-advantaged account this difference disappears.
Does the lower drawdown mean VTV is the safer long-term choice?
It means a shallower worst-case recovery path, which reduces the behavioral risk of selling near a bottom. Over a very long horizon with disciplined holding, the higher-drawdown fund can still deliver more — "safer" depends on whether you can actually hold through the deeper decline.
Do stocks move between the two funds?
Yes. CRSP reconstitutes the value and growth indices on a schedule with buffer zones to limit turnover, so a company can migrate from one to the other as its valuation and growth characteristics change. Style membership is a rules-based, moving classification.
Key takeaways
- VUG's 10-year outperformance (18.1% vs 12.6% CAGR) is real but regime-dependent; the trailing five-year gap narrows to under one point.
- The decisive difference is drawdown: -35.6% for VUG versus -17.0% for VTV, and the recovery math (55% vs 20% to break even) is where discipline is won or lost.
- These are two halves of one index, not rival products — owning both approximates a blend fund, and tilting is a deliberate overweight.
- VTV carries a higher, more tax-relevant dividend (1.9% vs 0.4%), favoring VUG modestly in taxable accounts and mattering not at all in sheltered ones.
- Both cost 0.03% and are deeply liquid, so the decision rests entirely on the return path you can hold, not on cost or implementation friction.
This article is for educational purposes and does not constitute personalized financial advice. See our full Disclaimer. Data sources: yfinance for price-derived figures (pulled 2026-07-15, windows of 5 and 10 years); Vanguard issuer profile pages for expense ratio and AUM; FRED for macro figures (10-year Treasury and CPI, as-of dates cited inline).