
Photo by Simran Sood on Unsplash
The short version
- Both funds target U.S. small-cap value, but AVUV applies a more aggressive systematic tilt toward value and profitability, while VBR tracks a broad value index at one-fifth the cost.
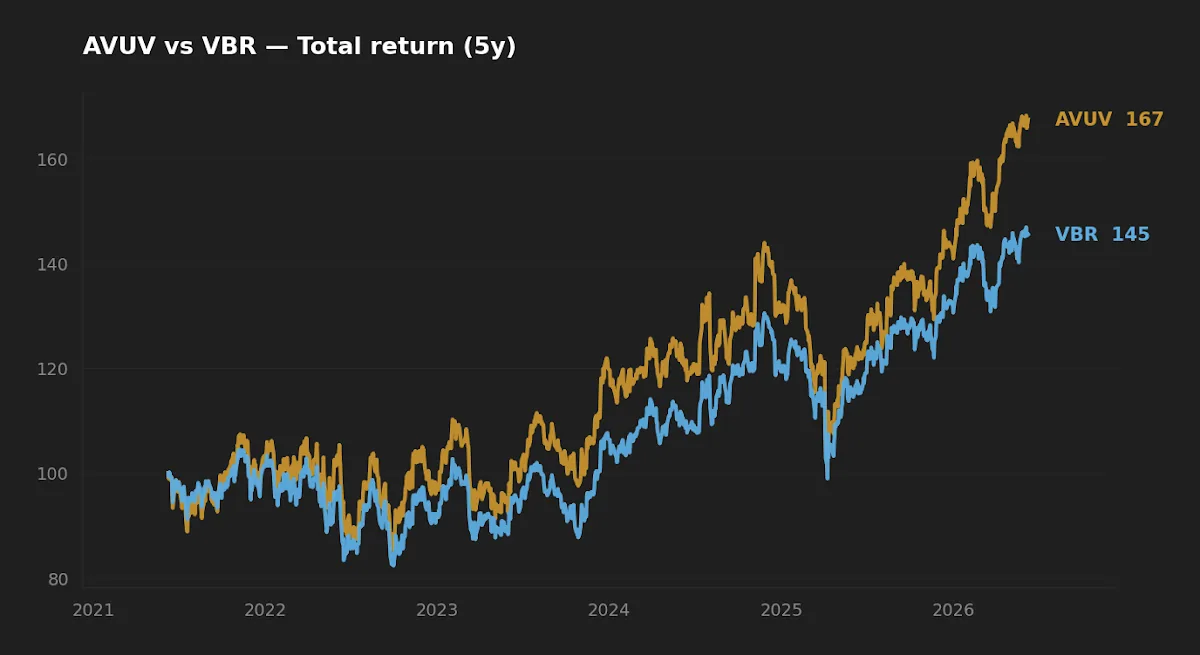
- Over the trailing five years AVUV returned 10.8% annualized versus VBR's 7.8% — but that window is essentially AVUV's entire live history and covers a single small-cap-value-friendly regime.
- Bottom line: AVUV is a concentrated factor bet with higher tracking error; VBR is the cheaper, broader, lower-variance index expression of the same idea.
Small-cap value is one of the few factor premia with decades of academic support behind it, from Fama and French's three-factor work onward. The practical question for a long-term investor is not whether the premium exists in the data, but how to access it: through a systematic, more concentrated selection process, or through a broad, low-cost index. AVUV and VBR are the two most common answers, and they are closer in spirit than the "active vs. passive" framing suggests.
This comparison uses realized data — not factor brochures — to ask where the 3-point annual return gap actually came from, and whether it is the kind of edge that survives across cycles or an artifact of one favorable window.
Context: two roads to the same factor
The Avantis US Small Cap Value ETF (AVUV) launched in September 2019. It is often labeled "active," but it is not discretionary stock-picking in the hedge-fund sense — it is a rules-based, systematic process that screens the small-cap universe and tilts harder toward stocks with low valuations and high profitability. That profitability screen is the key design choice; it is closer to a quality-value blend than a pure value sort.
The Vanguard Small-Cap Value Index Fund ETF (VBR) has tracked the CRSP US Small Cap Value Index since 2011. It holds a far broader basket, weights closer to the market, and reconstitutes on a fixed schedule. It is the index-approach baseline: cheap, diversified, and deliberately undramatic.
The macro backdrop matters for interpretation. With the federal funds rate at 3.63% and CPI running 3.9% year over year (FRED, asof 2026-05-01 and 2026-04-01 respectively), small caps have spent the recent period under a higher cost-of-capital regime than the 2010s — a regime that tends to punish unprofitable small companies. That is precisely the cohort AVUV's profitability screen is designed to underweight, which is worth keeping in mind when reading the return spread below.
The data
| Metric | AVUV | VBR |
|---|---|---|
| Name | Avantis US Small Cap Value | Vanguard Small-Cap Value |
| Expense ratio | 0.25% | 0.05% |
| AUM | $27.1B | $65.5B |
| Dividend yield | 1.3% | 1.8% |
| Inception | 2019-09-24 | 2011-09-27 |
| 5Y CAGR | 10.8% | 7.8% |
| 10Y CAGR | n/a (post-2019) | 10.6% |
| 5Y volatility (annualized) | 22.7% | 19.7% |
| 5Y max drawdown | −28.8% | −24.2% |
Price and return figures are from yfinance, pulled 2026-06-09; expense ratio, AUM, and yield are from issuer materials — the Avantis AVUV fact sheet and the Vanguard VBR profile.
Where the 3-point gap came from
The headline is the 3.0-percentage-point annual return advantage for AVUV (10.8% vs. 7.8%) over five years. The reflexive reading is "active beats index." I do not think that reading survives contact with the design details.
AVUV's edge is structural, not selective. By tilting more aggressively toward deep value and screening on profitability, it loads more heavily on the value and quality factors than VBR's broad, market-proximate index does. When those factors pay — as they did through much of the 2021–2024 small-cap value recovery — a higher loading mechanically produces a higher return. That is the same premium VBR holds, dialed up. The flip side is higher tracking error against any small-cap value benchmark and a wider dispersion of outcomes, which the realized statistics confirm: AVUV ran 22.7% annualized volatility against VBR's 19.7%, and drew down 28.8% at its worst versus VBR's 24.2%.
So the gap is better described as compensation for taking more concentrated factor risk than as evidence of selection skill. That distinction matters because it tells you what to expect when the regime turns: a higher loading cuts both ways.
AVUV's outperformance is the value and profitability premium dialed up, not stock-picking skill — and a higher factor loading is a promise that cuts in both directions.
Realized risk and the single-regime problem
Here is the constraint the marketing rarely states plainly: AVUV's five-year track record is essentially its entire live history. The fund launched in September 2019. Its 10.8% CAGR is therefore measured over one regime — a window that happened to be broadly favorable to small-cap value after a long stretch in which the factor underperformed. VBR, with a 2011 inception and a 10.6% ten-year CAGR, at least lets us see the factor across a flat-to-poor 2014–2020 stretch as well as the recent recovery.
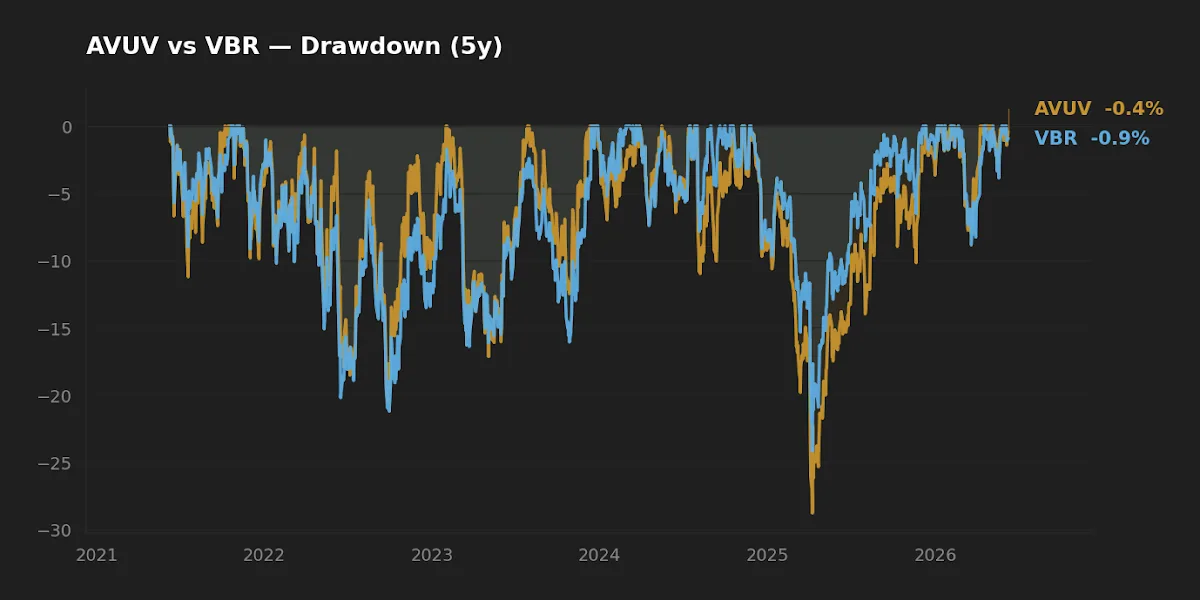
The drawdown chart makes the trade explicit. AVUV's deeper trough is the cost of its tighter factor concentration. An investor who held it through that −28.8% drawdown earned the premium; an investor who sold near the bottom converted a paper drawdown into a realized loss. This is where behavior, not the spreadsheet, decides outcomes. A fund that wins on a backtest but gets abandoned in a drawdown delivers nothing. I'd weight VBR's shallower realized drawdown more than its slightly lower return for any investor who has not lived through a small-cap drawdown before.
What the data cannot tell us is how AVUV behaves through a sustained value winter like 2014–2020 — because it did not yet exist. That is a genuine gap, not a quibble. The closest evidence we have is VBR's own muted decade-middle returns and the broader academic record on factor-timing, both of which counsel humility about extrapolating the last five years forward. I've written before about the patience the strategy demands in the case for small-cap value patience.
Cost, capacity, and implementation friction
The 20-basis-point fee gap (0.25% vs. 0.05%) is real but smaller than the factor-design gap. On a long horizon, 20 bp compounds to a meaningful drag — roughly 2% of terminal wealth over 30 years, all else equal — but here "all else" is not equal, because the two funds hold materially different baskets. This is the one comparison where I would not let the cheaper expense ratio decide the question on its own; the funds are not close enough substitutes for fee to be the swing variable.
A subtler point sits in capacity. Both funds are large — $65.5B for VBR, $27.1B for AVUV — and small-cap strategies face capacity limits that large-cap ones do not. A deep-value, more concentrated sleeve like AVUV's touches less-liquid names, where AUM growth can quietly widen the realized bid-ask cost of trading and push the portfolio toward larger, more liquid small caps over time. That is a slow, scale-induced drift worth monitoring rather than an immediate problem. VBR's broader, more liquid basket is structurally more capacity-tolerant. Both trade at tight spreads today given their scale; the question is forward, not current.
On distributions, VBR's 1.8% yield runs above AVUV's 1.3%, a function of VBR's broader, slightly higher-payout basket. Neither is a dividend vehicle, and the difference is small enough to be a rounding factor in an asset-location decision rather than a reason to choose. For readers weighing where small-cap value fits alongside other sleeves, I laid out the broader logic in the rationale behind a five-ETF long-term core.
| Category | Edge | Why |
|---|---|---|
| Cost | VBR | 0.05% vs. 0.25% — a 20 bp gap |
| Realized risk | VBR | Lower volatility (19.7% vs. 22.7%) and shallower drawdown (−24.2% vs. −28.8%) |
| Realized return (5Y) | AVUV | 10.8% vs. 7.8%, over a single favorable regime |
| Suitability (core) | VBR | Broader, cheaper, more capacity-tolerant baseline |
| Suitability (satellite tilt) | AVUV | Concentrated factor expression for investors who can hold through drawdowns |
FAQ
Is AVUV actively managed? It is systematic and rules-based, not discretionary. Avantis screens the small-cap universe and tilts toward value and profitability by formula. "Active" in the regulatory sense, but mechanically closer to a more aggressive index than to a stock-picking fund.
Why did AVUV outperform VBR over five years? Primarily because it loads more heavily on the value and profitability factors, and those factors paid over that window. The return spread is compensation for concentrated factor risk, visible in AVUV's higher volatility and deeper drawdown — not evidence of selection skill.
Can I hold both? They overlap heavily in factor exposure, so holding both mostly dilutes AVUV's tilt back toward the index. Most investors would pick one. Holding both makes sense only if you want partial factor concentration and accept that you're paying a blended fee for a blended tilt.
Does the 20 bp fee gap matter? It compounds over decades and is worth respecting, but here it is not the deciding variable — the two funds hold different enough baskets that factor design dominates fee. Let cost decide only between near-identical funds.
Which is safer in a downturn? Realized data favors VBR: lower five-year volatility (19.7% vs. 22.7%) and a shallower worst drawdown (−24.2% vs. −28.8%). Neither is defensive — both are small-cap equity and will fall hard in a broad sell-off.
Key takeaways
- AVUV and VBR access the same small-cap value premium; AVUV simply dials the value-and-profitability tilt up, which explains both its higher return and its higher risk.
- AVUV's 3-point five-year return edge was earned over a single, factor-friendly regime that coincides with its entire live history — the data cannot show how it behaves through a value winter.
- VBR wins on cost (0.05% vs. 0.25%), realized risk, and capacity tolerance; AVUV wins on realized return over the available window.
- The fee gap is real but secondary here — factor design, not expense ratio, drives the difference between these two funds.
- The decision is less "active vs. index" than "how concentrated a factor bet can you hold through a 28.8% drawdown without selling."
Editor's read
For a long-horizon core sleeve, the editor leans toward VBR: its lower variance, shallower realized drawdown, broader basket, and 0.05% fee make it the more durable baseline, and its longer history gives a fuller picture across regimes. AVUV is the more interesting instrument for an investor who specifically wants a sharper small-cap value tilt as a satellite position and has demonstrated — to themselves, in a real drawdown — that they can sit through the deeper troughs that concentration brings.
The editor holds AVUV as a small satellite position; does not hold VBR at the time of writing.
Methodology: price, return, volatility, and drawdown figures computed from yfinance daily data pulled 2026-06-09, over a trailing five-year window (AVUV's series begins at its 2019-09-24 inception). Expense ratio, AUM, and yield are from issuer fact sheets (Avantis, Vanguard) as of the same date. Macro figures from FRED (federal funds rate asof 2026-05-01; CPI year-over-year asof 2026-04-01).
This article is for educational purposes and does not constitute personalized financial advice. See our full Disclaimer.