
Photo by ola szkolda on Unsplash
The short version
- Both funds rotate factor exposure by rule, not by forecast — but OMFL blends several factors against a macro-regime signal while FCTR makes a near-binary switch between value and momentum.
- Over the trailing five years OMFL compounded at 9.0% with a −22.4% worst drawdown; FCTR compounded at 4.0% with a −37.1% drawdown — more risk for less realized return (yfinance, as of 2026-06-09).
- Bottom line: OMFL reads as the more defensible core-satellite candidate; FCTR carries a 0.65% fee, a $56M asset base, and concentration risk that the smaller investor pays for.
Factor rotation promises something seductive: own the factor that is working, step aside from the one that is not. Both Invesco's OMFL and First Trust's FCTR are built on that promise, and both execute it by rule rather than by a portfolio manager's hunch. The question worth asking is not which fund has the better story — both stories are coherent — but which rotation rule has actually been rewarded, and at what cost in fees, volatility, and drawdown.
This matters because rotation is the part of factor investing where the live-versus-backtest gap is widest. A static multifactor blend is easy to model. A rule that times factors adds a second layer of decisions, and every decision is a place where the live record can diverge from the simulation that sold the fund.
Context: two different definitions of "rotation"
The original framing of this comparison leaned on an "AI optimization" label for FCTR. That label is misleading, so set it aside. FCTR — the First Trust Lunt U.S. Factor Rotation ETF — is a rules-based fund that uses a relative-strength methodology to switch its U.S. large-cap exposure between a value sleeve and a momentum sleeve. It is systematic, but it is not a machine-learning product; it is a trend-following switch between two factor baskets.
OMFL — the Invesco Russell 1000 Dynamic Multifactor ETF — also rotates, but along a different axis. It reads a macroeconomic regime indicator (expansion, slowdown, contraction, recovery) and tilts a Russell 1000 portfolio across five factors — value, momentum, quality, low volatility, and size — in weights the index deems appropriate for that regime. So OMFL is a continuous multi-factor blend that shifts emphasis; FCTR is a concentrated two-state switch. They share a category label and almost nothing else mechanically. For readers building intuition here, our note on why factor investing still works covers the underlying Fama-French premia these funds are trying to harvest.
The data
All return, volatility, and drawdown figures below are computed from daily price history via yfinance (window: trailing five years to 2026-06-09). Expense ratio, AUM, and inception come from issuer fact sheets: Invesco (OMFL) and First Trust (FCTR).
| Metric | OMFL | FCTR |
|---|---|---|
| Name | Invesco Russell 1000 Dynamic Multifactor | First Trust Lunt U.S. Factor Rotation |
| Expense ratio | 0.29% | 0.65% |
| AUM | $4.7B | $0.06B |
| Inception | 2017-11-08 | 2018-07-25 |
| Dividend yield | 0.8% | 0.4% |
| 5Y CAGR | 9.0% | 4.0% |
| 5Y volatility (ann.) | 16.8% | 19.7% |
| 5Y max drawdown | −22.4% | −37.1% |
| NAV | $67.49 | $39.81 |
Neither fund has a ten-year record — OMFL launched in late 2017, FCTR in mid-2018 — so every number here sits inside a single, unusually eventful regime: the 2020 shock, the 2022 rate repricing, and the recovery that followed. That is one sample of history, not a distribution of histories. Keep that in front of you as you read the rest.
Realized return: the gap is wide and consistent
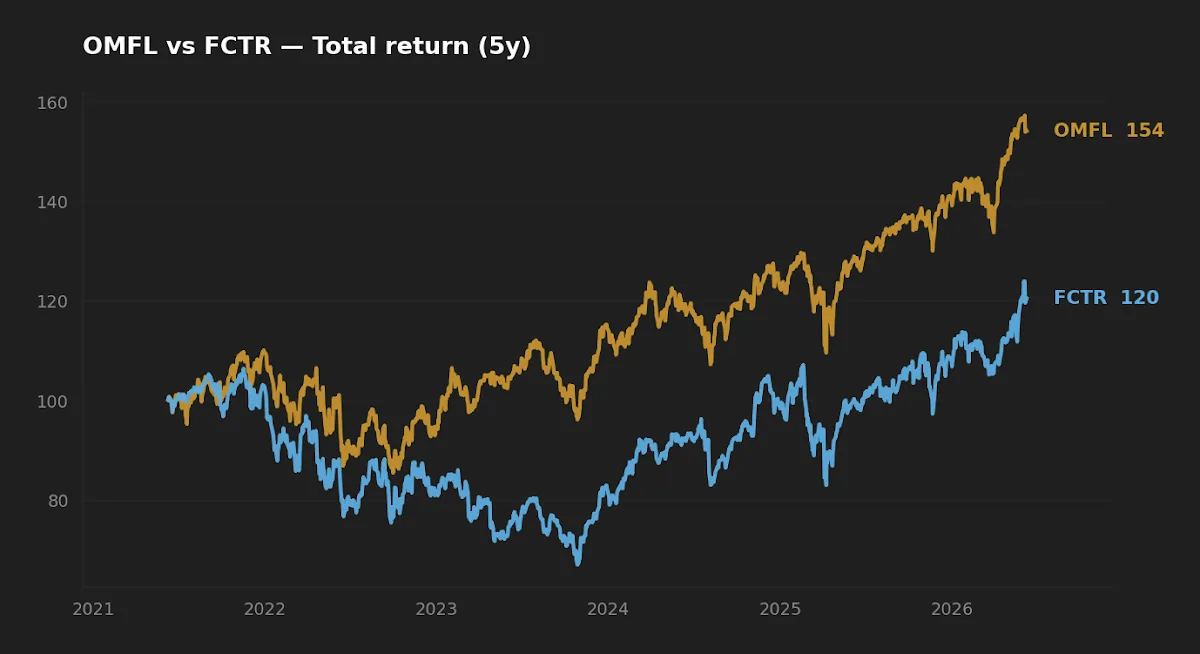
The 5.0-percentage-point CAGR gap is the headline, and the normalized total-return chart above shows it is not the product of a single lucky window — OMFL pulls ahead and stays ahead across most of the period. Compounded over five years, 9.0% versus 4.0% is not a rounding difference: a dollar in OMFL grew to roughly $1.54, the same dollar in FCTR to roughly $1.22. The dispersion between two funds in the same nominal category is the first thing that should give a rotation skeptic pause.
Some of the gap is structural. OMFL's continuous five-factor blend keeps it broadly invested and broadly diversified across factor premia at all times. FCTR's two-state switch concentrates into one sleeve at a time, which raises the stakes on each switch. When the relative-strength signal is right, concentration helps; when it is wrong, there is no second factor to cushion the miss.
Realized risk: the deeper drawdown tells the real story
FCTR took a −37.1% worst drawdown over the window against OMFL's −22.4%, and carried higher annualized volatility (19.7% versus 16.8%) while delivering less than half the return. That combination — more risk, less reward — is the cleanest possible verdict the data can hand down on a strategy. A fund can justify high volatility with high returns; it cannot justify high volatility with low ones.
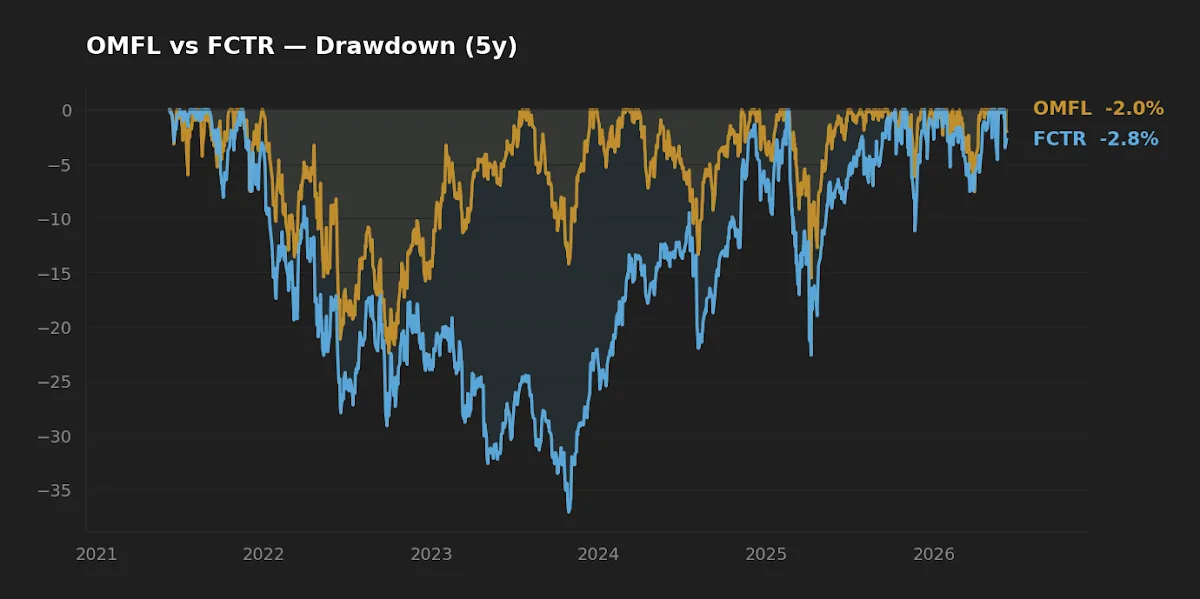
Here is the non-obvious part, and it is a timing asymmetry the headline CAGR hides. A relative-strength switch like FCTR's tends to be late on both ends. It rotates into momentum after momentum has already outperformed, and into value after value has already outperformed — because relative strength is, by construction, a trailing signal. At regime turning points, where leadership flips fastest, that lag is most expensive: the fund can buy the sleeve that is about to underperform and sell the one about to lead. Whipsaw at the turn is precisely where a two-state switch bleeds, and a −37% drawdown is consistent with exactly that failure mode. OMFL's macro-regime read is not immune to lag either, but spreading the bet across five factors means no single mistimed switch dominates the outcome.
A fund can justify high volatility with high returns; it cannot justify high volatility with returns less than half its rival's.
Cost and capacity: the part the smaller investor actually feels
FCTR charges 0.65% against OMFL's 0.29% — a 0.36% annual gap. On its own that is a meaningful drag over decades; layered on top of weaker gross returns, it compounds the disadvantage rather than offsetting it. There is no version of the fee math where FCTR's expense ratio is buying outperformance, at least not in this sample.
Then there is scale. OMFL holds roughly $4.7B; FCTR holds about $56M. A $56M factor-rotation fund sits in the zone where two frictions matter. First, bid-ask spreads on the ETF itself tend to be wider and less forgiving for anyone trading in size or at volatile opens. Second, sub-$100M funds carry genuine closure risk — issuers prune products that never reach scale, and a forced liquidation can hand shareholders an untimed taxable event. Neither friction shows up in a CAGR figure, which is exactly why they are easy to ignore until they cost you. The same scale-and-spread lens applies across this corner of the market; we walk through it in more detail in FCTR vs LRGF and in the COWZ vs FCTR comparison.
A note on the regime these returns lived through
Both records were earned in a high-inflation, rising-then-plateauing rate environment. As of the latest readings, the federal funds rate stood at 3.63% (FRED, as of 2026-05-01) and headline CPI ran at 3.9% year over year (FRED, as of 2026-04-01). A macro-regime fund like OMFL is, in principle, built for exactly this kind of shifting backdrop — its indicator is supposed to detect the slowdown-to-recovery transitions that defined 2020–2024. Its relative outperformance is consistent with the regime signal adding value here, but one regime cycle is not enough to separate skill from a single favorable draw. That is the honest limit of the evidence, and our broader take on positioning through these shifts lives in Repositioning Without Prediction.
Scoreboard
| Category | Winner | Why |
|---|---|---|
| Cost | OMFL | 0.29% vs 0.65% — a 0.36% annual edge |
| Realized risk | OMFL | −22.4% vs −37.1% drawdown; lower volatility |
| Realized return | OMFL | 9.0% vs 4.0% 5Y CAGR |
| Suitability / capacity | OMFL | $4.7B vs $56M — lower spread and closure risk |
Scenarios where each fund fits
Reader in their 30s, 401(k)-only, wants one rules-based factor tilt alongside a broad index core → OMFL is the more defensible candidate: cheaper, more diversified across factors, and large enough that spread and closure risk are minor. It functions as a satellite, not a core replacement.
Reader who specifically wants concentrated value/momentum timing and accepts the friction → FCTR expresses that thesis more purely, but the investor should size it as a small satellite, budget for the wider spread, and accept that the live record so far has not rewarded the structure.
Reader who simply wants factor exposure without rotation timing → neither — a static multifactor or single-factor fund removes the timing layer entirely, which our VOO vs MTUM vs QUAL piece examines.
What this comparison can and can't tell you
It can tell you that, in one five-year regime, OMFL delivered more return for less risk at lower cost — a clean, consistent result. It cannot tell you whether that holds across regimes the sample never contained: a prolonged value-led decade, a sideways grind where trend signals whipsaw repeatedly, or a deflationary shock. With no ten-year record and a single macro cycle in the data, both funds remain under-tested. Survivorship and single-regime risk are live here, not theoretical.
FAQ
Is FCTR an AI or machine-learning fund?
No. Despite labels sometimes attached to it, FCTR uses a rules-based relative-strength methodology to rotate between value and momentum sleeves. It is systematic trend-following, not machine learning.
Why did OMFL outperform FCTR so clearly?
Over the trailing five years OMFL returned 9.0% CAGR versus FCTR's 4.0% (yfinance, 2026-06-09), with a shallower drawdown. Its continuous five-factor blend stayed diversified, while FCTR's two-state switch concentrated risk and appears to have lagged at regime turns.
Does FCTR's $56M size actually matter?
It can. Sub-$100M ETFs tend to carry wider bid-ask spreads and a higher probability of eventual closure, which can force an untimed taxable event on shareholders. OMFL's $4.7B base largely removes both concerns.
Is the 0.36% fee difference large?
Over a single year it is small; over decades it compounds meaningfully. Combined with FCTR's weaker gross returns in this sample, the higher fee deepens the gap rather than buying anything back.
Can I use either as a portfolio core?
Both are better understood as satellite tilts than as a core holding. A rotation rule adds a timing layer most long-horizon investors do not need on their core; pairing a broad index core with a small factor satellite is the more common structure.
Key takeaways
- OMFL won every measured category in this five-year sample: cost (0.29% vs 0.65%), realized return (9.0% vs 4.0%), realized risk (−22.4% vs −37.1% drawdown), and capacity ($4.7B vs $56M).
- "Rotation" means different things here — OMFL blends five factors by macro regime; FCTR switches between two by relative strength. The mechanics, not the label, drive the outcomes.
- Relative-strength switching is a trailing signal, most expensive at regime turning points — a plausible source of FCTR's deeper drawdown.
- Both funds lack a ten-year record and lived through one regime; treat every figure as a single draw, not a distribution.
- Fund scale is an unpriced risk: FCTR's small asset base carries spread and closure frictions that no CAGR figure captures.
Editor's read
If forced to hold one of these as a factor satellite, the editor leans toward OMFL — not because rotation is proven, but because OMFL wins on the variables that are knowable in advance: it is cheaper, more diversified, and large enough to avoid spread and closure friction, and its live record so far has rewarded those choices. FCTR's concentrated value/momentum switch is intellectually clean, but a strategy delivering less than half the return at higher volatility and a 0.65% fee has to clear a bar this sample does not show it clearing.
The editor does not hold either fund at the time of writing.
Methodology: Return, volatility, and drawdown computed from daily adjusted prices via yfinance, trailing five-year window ending 2026-06-09. Expense ratio, AUM, dividend yield, and inception from issuer fact sheets (Invesco for OMFL, First Trust for FCTR), pulled 2026-06-09. Macro figures from FRED (federal funds rate as of 2026-05-01; CPI year-over-year as of 2026-04-01).
This article is for educational purposes and does not constitute personalized financial advice. See our full Disclaimer.