
Photo by PiggyBank on Unsplash
The short version
- VNQ and SCHH are both broad U.S. equity REIT index funds with nearly identical realized volatility (~18.8% vs ~18.7% over five years), so the decision rarely turns on risk.
- SCHH is cheaper (0.07% vs 0.13%) and edged VNQ over the trailing five years, but VNQ's broader index won decisively over ten — and carries a higher, mostly non-qualified, distribution yield.
- Bottom line: SCHH suits a cost-minimizing taxable holder who wants the leanest equity-REIT beta; VNQ suits an investor who wants the widest real-estate universe and is comfortable in a tax-advantaged account.
The question for anyone allocating to listed real estate is rarely "should I own REITs?" — it is "which broad REIT index fund, and does the choice actually matter?" VNQ and SCHH are the two most obvious candidates: both are passive, both track the U.S. equity REIT market, and both are cheap. This article looks at what the realized data says about the gap between them, and where that gap is large enough to change a decision.
Context: what these two funds actually are
The Vanguard Real Estate ETF (VNQ) launched in December 2003 and tracks the MSCI US Investable Market Real Estate 25/50 Index. Its universe is broad: it reaches deep into specialized REITs — data centers, cell towers, industrial, timber — and historically has included a sliver of real-estate management and development companies that sit just outside the pure-REIT definition. At roughly $69.8B in assets (issuer data, asof 2026-06-09), it is the scale leader of the category.
The Schwab U.S. REIT ETF (SCHH) launched in January 2011 and tracks the Dow Jones Equity All REIT Capped Index. Its construction is narrower by design: equity REITs only, with mortgage REITs screened out. At about $10.0B in assets, it is a fraction of VNQ's size but still well clear of any liquidity or capacity concern for a long-term holder.
Both funds sit in a rate-sensitive corner of the market. With the federal funds rate at 3.63% (FRED, asof 2026-05-01) and CPI still running at 3.9% year over year (FRED, asof 2026-04-01), REIT cash flows have been discounted at a higher rate than the prior decade trained investors to expect. That regime shapes the five-year numbers below and is worth holding in mind.
The data side by side
| Metric | VNQ | SCHH |
|---|---|---|
| Expense ratio | 0.13% | 0.07% |
| AUM | $69.8B | $10.0B |
| Inception | 2003-12-02 | 2011-01-13 |
| Distribution yield | 3.6% | 2.8% |
| 5Y CAGR | 2.3% | 3.1% |
| 10Y CAGR | 5.4% | 4.2% |
| 5Y volatility (annualized) | 18.8% | 18.7% |
| 5Y max drawdown | −34.5% | −33.3% |
| NAV | $96.80 | $23.69 |
Price/return figures are from yfinance (pulled 2026-06-09); expense ratio, AUM, yield, and inception are from each issuer's fact sheet on the same date.
The return inversion that does the real work
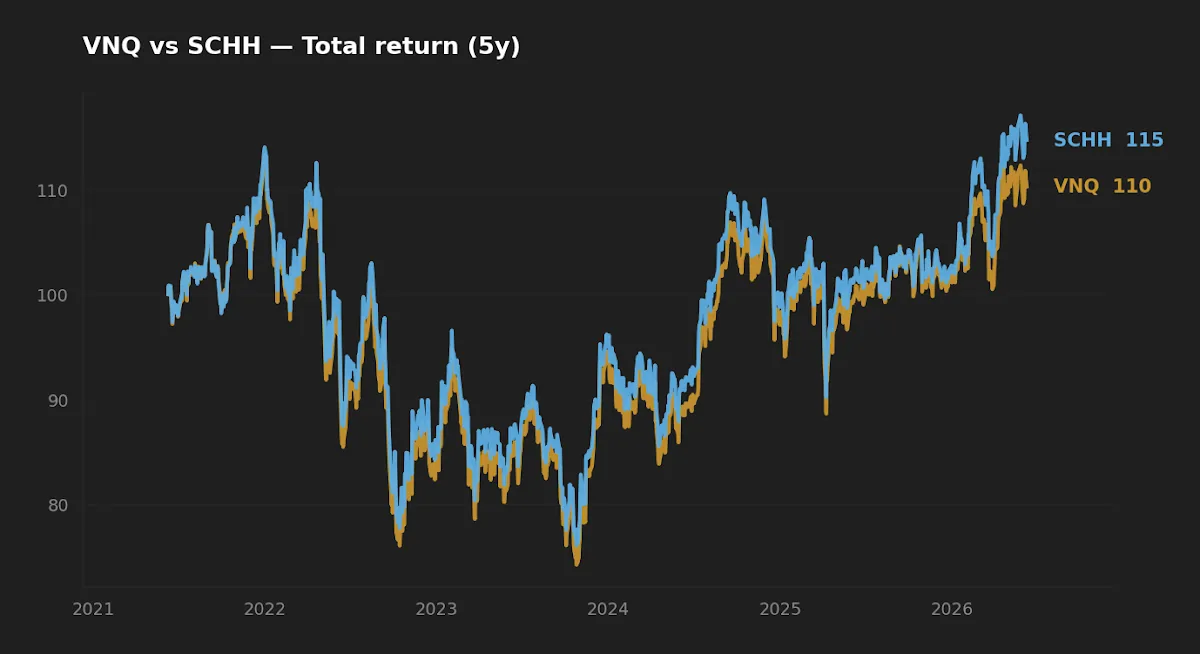
The first thing worth sitting with is that the two funds disagree depending on the window. Over the trailing five years, SCHH edged ahead — 3.1% CAGR versus 2.3% for VNQ. Over ten years, the order flips and the gap widens the other way: VNQ at 5.4% versus 4.2% for SCHH.
Initially I read the five-year lead as evidence that the cheaper, leaner fund simply compounds better. Then I lined the windows up and the explanation turned out to be index construction, not cost. VNQ's broader index gave it heavier exposure to the specialized-REIT subsectors — towers, data centers, industrial logistics — that re-rated hardest from 2015 through 2021. SCHH's narrower, more traditional equity-REIT mix carried less of that. When those high-multiple subsectors derated under higher rates, VNQ gave back more of the gain, and the recent five years favored SCHH's plainer composition. The 6-basis-point fee difference is real, but it is not what drove the spread between these two lines.
The five-year and ten-year rankings disagree, and the reason is index breadth, not the 6-basis-point fee — which is exactly why a single trailing number is the wrong way to choose between them.
This is the data-mining trap in miniature. Pick the window that flatters your preferred fund and either one "wins." The honest reading is that they are two slightly different bets on the same asset class: VNQ is a wider, more specialized-tilted slice of listed real estate; SCHH is a more concentrated equity-REIT core. Neither is structurally superior; they express different exposures.
Realized risk: nearly a tie
If the return picture is window-dependent, the risk picture is refreshingly stable. Five-year annualized volatility is 18.8% for VNQ and 18.7% for SCHH — inside the noise. Maximum drawdown over the same window was −34.5% for VNQ and −33.3% for SCHH. VNQ fell marginally further, consistent with its heavier weight in the more volatile specialized subsectors, but the difference is small enough that no risk-averse investor should choose between these two funds on drawdown alone.
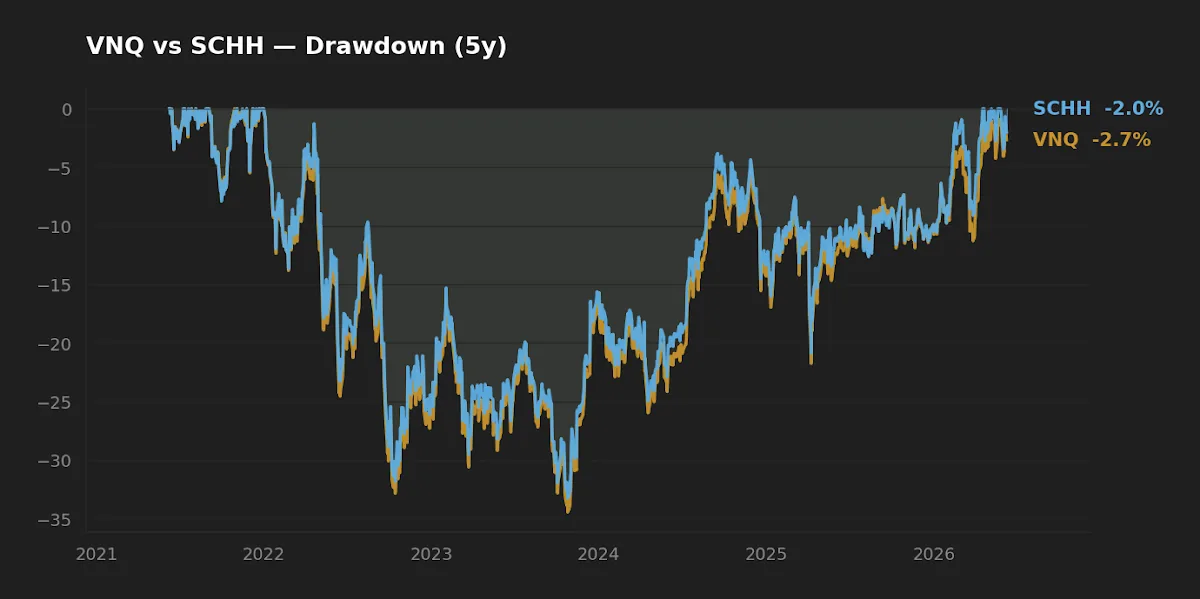
What the drawdown chart underlines is that both funds are full-blooded equity exposure, not a defensive sleeve. A one-third peak-to-trough decline is the behavioral test that matters: an investor who would sell at −34% should size the position with that number in front of them, not the yield. For genuine ballast, a short-duration instrument like the one discussed in SGOV's role as a cash floor behaves very differently from a REIT fund, and the two should not be confused.
The yield difference is smaller than it looks after tax
VNQ distributes 3.6% against SCHH's 2.8% — an 80-basis-point yield advantage that, on the surface, favors the income-minded holder. The second-order effect is where it gets less flattering. REIT distributions are predominantly non-qualified ordinary income; they generally do not receive the lower qualified-dividend tax rate. In a taxable account, a higher REIT yield therefore drags harder through a higher tax-cost ratio. VNQ's extra yield is partly a higher tax bill, not free income.
The practical implication is placement, not preference. Both funds are better held in a tax-advantaged account; and if one must sit in taxable, the lower-yielding SCHH is marginally more tax-efficient at the distribution level. This is the kind of friction that compounds quietly over decades — faithfulness in small things, in the basis-point sense. For a fuller treatment of how a higher headline yield can mislead, the analysis in SCHD vs VOO on yield versus total return applies directly here.
Scoreboard
| Category | Winner | Why |
|---|---|---|
| Cost | SCHH | 0.07% vs 0.13% — a 6 bp edge. |
| Realized risk | Tie | 18.7% vs 18.8% vol; −33.3% vs −34.5% drawdown. |
| Realized return | Split | SCHH over 5Y; VNQ over 10Y. |
| Tax efficiency (taxable) | SCHH | Lower non-qualified distribution drag. |
| Breadth / suitability | VNQ | Wider universe, larger AUM, specialized-REIT exposure. |
Frequently asked questions
Is SCHH just a cheaper VNQ? No. The 6 bp fee difference is real, but the funds track different indexes. VNQ's universe is broader and tilts more toward specialized REITs; SCHH is a narrower equity-REIT-only mix. They are similar, not identical.
Why did VNQ win over ten years but lose over five? Index breadth. VNQ's heavier specialized-REIT weight benefited from the 2015–2021 re-rating of towers, data centers, and industrial, then gave more back under higher rates. The window you pick determines the "winner," which is why one trailing number is a poor basis for the decision.
Which is more tax-efficient? REIT distributions are mostly ordinary (non-qualified) income. SCHH's lower yield means a marginally lighter tax-cost ratio in a taxable account. Both are generally better held in tax-advantaged space.
Does SCHH's smaller size ($10.0B) create liquidity risk? Not at a meaningful level for a long-term holder. $10.0B is large in absolute terms; bid-ask spreads and closure risk are negligible concerns relative to VNQ's $69.8B.
Do these belong in a long-term core? They are sector exposure, not a total-market core. A −34% realized drawdown means listed real estate is a satellite tilt for most investors, sized deliberately — see VNQ vs PPTY for how active and passive real-estate approaches differ.
What this comparison can and can't tell you
The five- and ten-year windows cover one broad rate cycle and a single inflation regime. They do not include a 1970s-style sustained inflation or a 2008-style real-estate-led crisis as the lead shock. Realized volatility and drawdown are backward-looking and say nothing about the next regime. The yield and expense figures are point-in-time issuer data and will drift. Treat the numbers as evidence about how these funds have behaved, not a forecast of how they will.
Scenarios where each fund fits
Reader in their 30s, 401(k)-only, no current real-estate exposure, wants the leanest equity-REIT beta: SCHH's lower fee and tighter equity-REIT construction is the cleaner fit, and the tax point is moot inside a 401(k).
Reader holding REITs in a taxable brokerage account: SCHH's lower non-qualified yield reduces the annual tax drag; placement matters more than the fund choice itself.
Reader who wants the widest possible listed-real-estate exposure, including specialized subsectors, in a tax-advantaged account: VNQ's broader index and scale make it the more complete expression.
Editor's read
If forced to pick one for a satellite real-estate sleeve, the editor leans toward SCHH for a taxable account — the lower fee and lighter non-qualified distribution drag are the durable, repeatable edges, while the five-year return lead is not something to lean on. In a tax-advantaged account the case narrows considerably, and VNQ's broader universe and scale become the more defensible choice. The two are closer to interchangeable than the marketing of either would suggest.
The editor does not hold either VNQ or SCHH at the time of writing.
Key takeaways
- VNQ and SCHH are both broad U.S. equity REIT index funds with near-identical realized risk (~18.8% vs ~18.7% vol; −34.5% vs −33.3% drawdown).
- SCHH is cheaper (0.07% vs 0.13%) and led over five years; VNQ led over ten — the disagreement is driven by index breadth, not fees.
- VNQ's higher 3.6% yield is partly a higher tax bill, since REIT distributions are largely non-qualified ordinary income.
- Both are sector exposure with full equity-like drawdowns — a deliberately sized satellite, not a core or a defensive sleeve.
Methodology. Price and total-return series, CAGR, volatility, and drawdown computed from yfinance daily data over trailing 5- and 10-year windows, pulled 2026-06-09. Expense ratio, AUM, distribution yield, and inception from Vanguard and Schwab Asset Management fact sheets, same date. Macro figures from FRED (federal funds rate asof 2026-05-01; CPI year-over-year asof 2026-04-01).
This article is for educational purposes and does not constitute personalized financial advice. See our full Disclaimer.