
Photo by Natalia Gusakova on Unsplash
The short version
- XLV holds roughly 60 large-cap S&P 500 healthcare names; VHT holds around 400 across the full U.S. cap spectrum — the same sector, two different portfolios.
- The fee gap is one basis point (0.08% vs 0.09%), so for once cost is not the deciding variable. Structure is.
- Bottom line: VHT's broader small- and mid-cap tail added realized volatility over the last five years without a clear return premium; XLV was the calmer of the two in the drawdown.
Two funds, one sector, and a decision that most cost-comparison checklists get wrong. XLV and VHT both promise U.S. healthcare exposure, and they charge within a basis point of each other. The interesting question is not which is cheaper — it is what you actually own when you buy each one, and whether the broader fund's extra 340 holdings buy you diversification or just more variance.
Healthcare sits in most long-horizon portfolios for a specific reason: relatively inelastic demand tends to make sector earnings less cyclical than the broad market. That defensive reputation is worth testing against realized data rather than assuming. Below, the two largest healthcare index ETFs are compared on structure, cost, realized risk, and behavior in stress — using price data pulled from yfinance on 2026-07-15 and expense and holdings figures from the issuer fact sheets.
Context: same sector, two definitions of it
The gap between these funds starts with their indexes. XLV — the Health Care Select Sector SPDR — tracks only the healthcare members of the S&P 500. That is a large-cap universe of roughly 60 to 65 names, cap-weighted, with a heavy concentration in mega-cap pharma, managed care, and medical devices. VHT — Vanguard's Health Care Index ETF — tracks a broad U.S. healthcare benchmark spanning large, mid, and small caps, holding on the order of 400 stocks.
So VHT is not "XLV plus a bit more." It is XLV's large-cap core plus a long tail of mid- and small-cap biotech, tools, and services firms. That tail is where the two funds diverge in behavior. The names are structurally different animals: profitable mega-cap pharma at the top, pre-revenue or single-product biotech further down. Whether that tail helps or hurts is an empirical question, not a marketing one, and it is the crux of this comparison.
The data
| Metric | XLV | VHT |
|---|---|---|
| Full name | Health Care Select Sector SPDR | Vanguard Health Care Index ETF |
| Expense ratio | 0.08% | 0.09% |
| AUM | $40.6B | $20.4B |
| Inception | 1998-12-16 | 2004-02-05 |
| Holdings (approx.) | ~60 | ~400 |
| Distribution yield | 1.6% | 1.6% |
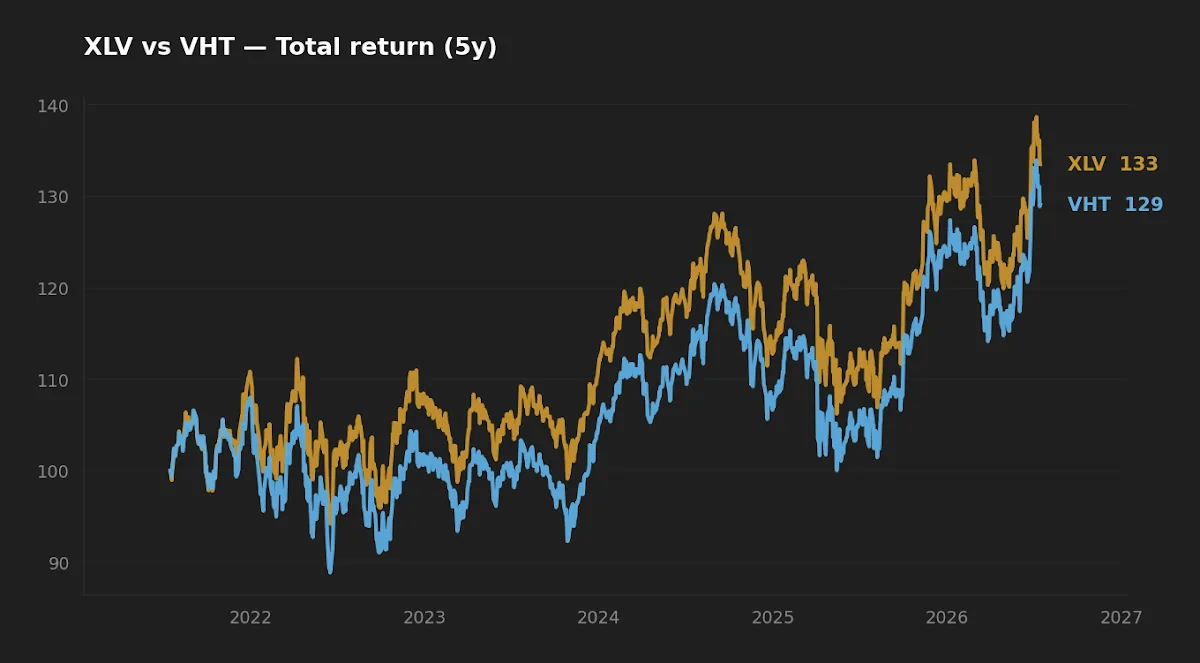
| 5Y CAGR | 6.0% | 5.2% |
| 10Y CAGR | 9.9% | 10.1% |
| 5Y volatility (annualized) | 14.9% | 15.2% |
| Max drawdown, 5Y | -17.1% | -17.7% |
Sources: expense ratio, AUM, inception, and holdings counts from the issuer fact sheets (sectorspdrs.com/mainfund/xlv and investor.vanguard.com — VHT); price, return, volatility, and drawdown from yfinance, pulled 2026-07-15. CAGR and drawdown are computed on total-return-adjusted daily prices over trailing 5- and 10-year windows.
Cost is a rounding error here — so ignore it
At 0.08% versus 0.09%, the fee difference is one basis point. On a $100,000 position that is $10 a year. Over a multi-decade horizon the compounded drag is real but negligible relative to the structural differences between the two portfolios. I usually argue that basis points matter and that cost compounds — faithfulness in small things — and it does. But part of that same discipline is recognizing when a cost gap is small enough that it should not drive the decision at all. This is one of those cases. Anyone choosing between XLV and VHT on the fee line is optimizing the wrong variable.
Liquidity and scale are a more meaningful practical distinction. XLV, at $40.6B in assets, is one of the most heavily traded sector funds in the market, with correspondingly tight bid-ask spreads. VHT, at $20.4B, is also large and liquid, though its spreads on the small-cap portion of the book are inherently a touch wider because the underlying names trade less. For a buy-and-hold investor placing occasional orders, neither presents a real friction. For anyone trading in size, XLV's depth is the marginal edge.
Realized risk: breadth did not lower it
Here is the counterintuitive part, and the one insight worth carrying away from this comparison. Intuition says the fund with ~400 holdings should be better diversified and therefore less volatile than the fund with ~60. The realized data says the opposite. Over the trailing five years, VHT posted slightly higher annualized volatility (15.2% vs 14.9%) and a deeper maximum drawdown (-17.7% vs -17.1%) than the more concentrated XLV.
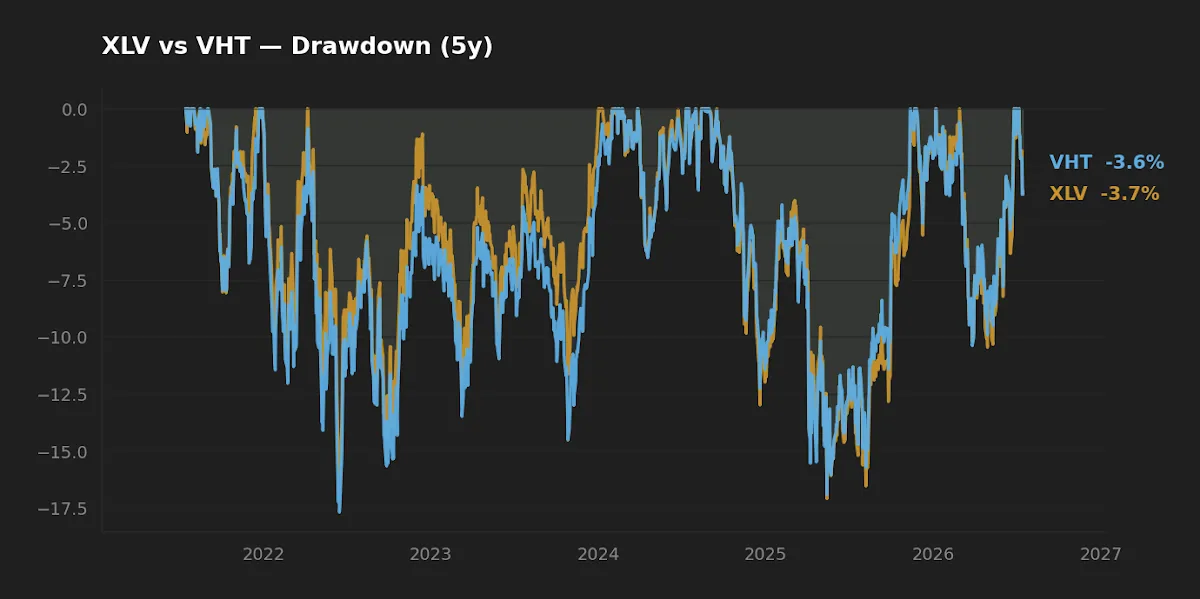
The reason is factor exposure, not name count. Breadth reduces risk only when the added names are lower-beta than the ones you already hold. VHT's incremental holdings — its mid- and small-cap biotech and tools tail — are structurally higher-beta than the mega-cap pharma and managed-care giants that dominate both funds. Adding higher-beta names to a portfolio raises its volatility even as it raises its holding count. So VHT is more diversified by number and less defensive by behavior. XLV's concentration in large, cash-generative healthcare franchises is precisely what made it the steadier of the two through the drawdown.
VHT is more diversified by name count and less defensive by behavior — because breadth only lowers risk when the names you add are calmer than the ones you already hold.
This is the same tension that shows up whenever a fund broadens its universe. It appeared in the small-cap screens I looked at in CALF vs AVUV, and in the concentration contrast between the two semiconductor funds in SMH vs SOXX. More holdings is not automatically more safety; it depends entirely on the beta of what gets added.
Return: a coin flip that flips with the window
On returns, the two funds essentially trade places depending on the measurement window. Over five years XLV edged ahead (6.0% vs 5.2% CAGR); over ten years VHT edged ahead (10.1% vs 9.9%). Those gaps are small enough — under one percentage point in both directions — that they are better read as window-dependent noise than as evidence of a durable edge for either structure.
The honest interpretation is that the small-cap tail in VHT is a factor bet that has neither clearly paid off nor clearly failed over the periods we can measure. In windows where small-cap biotech rallies, VHT's breadth should help; in defensive, risk-off windows, XLV's large-cap tilt should hold up better, which is roughly what the five-year drawdown shows. Neither is "the better fund" in the abstract. They express different views on where within healthcare the return will come from.
The macro frame
Healthcare's defensive case looks different in a higher-rate world. With the 10-year Treasury at 4.58% and the fed funds rate at 3.63% (FRED, asof 2026-07-14 and 2026-06-01), a 1.6% distribution yield from either fund is not an income story — it is well below the risk-free rate. These are total-return, sector-tilt vehicles, not yield instruments, and should be evaluated as such. With the VIX at 16.5 (FRED, asof 2026-07-14), volatility is subdued, which is exactly the regime in which the defensive difference between XLV and VHT is hardest to see. The gap tends to widen when stress arrives, as the five-year drawdown chart hints. For a broader look at the defensive-sleeve question, see the earlier note on what SGOV and gold actually do.
Scoreboard
| Category | Edge | Why |
|---|---|---|
| Cost | XLV (marginal) | 0.08% vs 0.09% — a rounding error, not a reason. |
| Realized risk (5Y) | XLV | Lower volatility (14.9%) and shallower drawdown (-17.1%). |
| Realized return | Split | XLV over 5Y, VHT over 10Y; sub-1% gaps either way. |
| Breadth / completeness | VHT | ~400 holdings including mid- and small-cap healthcare. |
| Liquidity / scale | XLV | $40.6B AUM, tightest spreads in the sector. |
Frequently asked questions
Is VHT just XLV with more stocks? No. VHT adds a mid- and small-cap tail that XLV does not hold at all. That tail is higher-beta, so VHT behaves differently in stress — it is a different risk profile, not a superset with the same characteristics.
Why does the more diversified fund have higher volatility? Because diversification lowers risk only when the added holdings are less volatile than the existing ones. VHT's extra names are small- and mid-cap biotech and tools firms, which are structurally higher-beta than the mega-cap core both funds share.
Does the one-basis-point fee difference matter? Not enough to decide on. It is roughly $10 per year on a $100,000 position. Structure, factor exposure, and liquidity are far larger considerations here than the 0.08% vs 0.09% gap.
Are these good income funds? No. Both distribute about 1.6%, well under the 4.58% 10-year Treasury yield (FRED, asof 2026-07-14). They are sector total-return vehicles, not income holdings.
Which one is more "defensive"? On five years of realized data, XLV — it showed lower volatility and a shallower maximum drawdown, driven by its concentration in large-cap, cash-generative healthcare franchises.
What this comparison can and can't tell you
Five and ten years is a limited sample covering a specific set of regimes — it does not include a full biotech bear cycle or a major sector-specific policy shock. Realized volatility and drawdown are backward-looking; the beta relationship between VHT's small-cap tail and its large-cap core can shift. Nothing here forecasts future returns, and the sub-1% return gaps in both directions are well inside the range of noise.
Scenarios where each fits
A reader who wants the most defensive, most liquid expression of large-cap U.S. healthcare, and who treats the sector as a stability tilt within a broad portfolio, is describing XLV's profile. A reader who specifically wants exposure to mid- and small-cap healthcare innovation — and accepts modestly higher volatility for it — is describing VHT's. An investor whose broad-market fund already captures most large-cap pharma may find VHT's incremental small-cap tail the more additive of the two. The choice is about which slice of healthcare you are underexposed to, not about cost.
Editor's read
If the goal is a defensive healthcare tilt inside a long-horizon core, the editor leans slightly toward XLV: on the data we have, its large-cap concentration delivered lower realized volatility and a shallower drawdown, and its liquidity is best-in-class — with a fee gap too small to argue about. VHT is the better choice for someone deliberately seeking the mid- and small-cap tail as an added factor bet, but that tail should be understood as risk-adding, not risk-reducing.
The editor does not hold either XLV or VHT at the time of writing.
Key takeaways
- The 1-basis-point fee gap is not the decision; structure and factor exposure are.
- XLV = ~60 large-cap S&P 500 healthcare names; VHT = ~400 across the full cap spectrum.
- Over five years, VHT's broader book carried higher volatility (15.2% vs 14.9%) and a deeper drawdown (-17.7% vs -17.1%) — breadth did not lower risk.
- Returns are a window-dependent coin flip: XLV over 5Y, VHT over 10Y, both under a 1% gap.
- At ~1.6% yield versus a 4.58% 10-year Treasury, neither is an income holding.
Methodology: Price, total return, volatility, and drawdown computed from yfinance daily data pulled 2026-07-15, over trailing 5- and 10-year windows. Expense ratio, AUM, inception, and holdings counts from issuer fact sheets (State Street SPDR for XLV; Vanguard for VHT). Macro figures from FRED, asof dates as cited.
This article is for educational purposes and does not constitute personalized financial advice. See the full Disclaimer.