
Photo by mehdi pezhvak on Unsplash
The short version
- Both funds screen small-caps for "quality," but on different variables: CALF ranks by free-cash-flow yield, AVUV by valuation crossed with profitability.
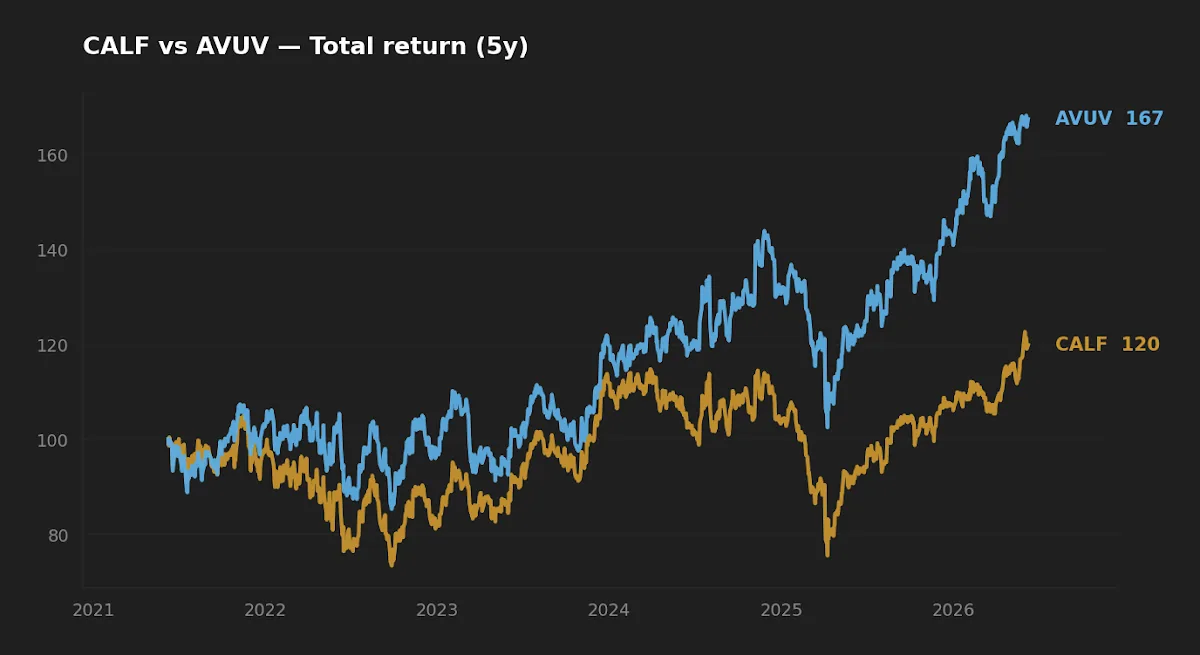
- Over the trailing five years the two carried almost identical realized volatility (~23%), yet AVUV returned roughly 10.8% annualized against CALF's 4.2% — nearly the same risk for more than double the return.
- Bottom line: AVUV's multi-factor construction and 34 bp cost advantage make it the more defensible long-horizon core holding; CALF is the narrower, single-metric satellite bet.
Two small-cap funds, two "quality" screens, and a six-and-a-half-point annual return gap that almost no one would have predicted from the marketing copy alone. The Pacer US Small Cap Cash Cows 100 ETF (CALF) and the Avantis US Small Cap Value ETF (AVUV) both promise to fix the central problem with small-cap indexing — that the bottom of the market-cap distribution is littered with unprofitable, speculative companies — but they reach for different levers. The question this article works through is narrow and answerable: given five years of realized data, which screen actually delivered, and what does the gap tell us about how to weight the two going forward?
Context: two different definitions of "quality"
Plain small-cap indexes (think the Russell 2000) are cap-weighted buckets that include a large tail of firms with negative earnings. The academic case for tilting small — the size premium from Fama and French — has always been entangled with this junk problem: a meaningful slice of historical small-cap underperformance comes from the lowest-quality names. Both CALF and AVUV are attempts to keep the size exposure while filtering the tail. They just disagree on the filter.
CALF starts with the S&P SmallCap 600 and selects the 100 names with the highest trailing free-cash-flow yield (free cash flow divided by enterprise value), then weights by that same metric. It is a single-variable, rules-based screen built around one idea: companies that generate cash relative to their valuation tend to be durable. AVUV, by contrast, is a systematically managed fund — not a pure index — that buys across a broad small-cap value universe and tilts toward stocks that are cheap on book-to-price and show high profitability (a return-on-assets style screen). That second profitability gate is the AVUV design choice that matters most, and we will come back to it. For background on the size-and-value case AVUV is built to harvest, see AVUV and the Case for Small-Cap Value Patience; for the free-cash-flow family CALF belongs to, see COWZ vs. FCTR.
The data
| Metric | CALF | AVUV |
|---|---|---|
| Name | Pacer US Small Cap Cash Cows 100 | Avantis US Small Cap Value |
| Expense ratio | 0.59% | 0.25% |
| AUM | $3.5B | $27.1B |
| Inception | 2017-06-16 | 2019-09-24 |
| Distribution yield | 1.3% | 1.3% |
| 5Y CAGR | 4.2% | 10.8% |
| 5Y volatility (annualized) | 23.4% | 22.7% |
| 5Y max drawdown | −34.2% | −28.8% |
Price and return figures are from yfinance, pulled 2026-06-09; expense ratio, AUM, and methodology are from the issuer fact sheets (Pacer CALF and Avantis AVUV). Note that 10-year figures are unavailable for both — AVUV did not exist before late 2019 — so every comparison here lives inside a single, unusually eventful five-year window.
Why the return gap is wider than the risk gap
The headline is not just that AVUV returned more. It is that AVUV returned more than twice as much while taking slightly less realized volatility — 22.7% versus 23.4% — and suffering a shallower maximum drawdown, −28.8% versus −34.2%. On a crude return-per-unit-of-volatility basis, AVUV's ratio is roughly 0.48 against CALF's 0.18. The two funds are not trading return for risk along the same line; one simply sat closer to the efficient frontier over this window.
Where does the gap come from? My initial read was that CALF's free-cash-flow screen would behave like a quality factor and dampen drawdowns. The drawdown data did not support that — CALF fell further in the worst stretch. The more durable explanation is sector composition. A high-FCF-yield screen applied to small-caps tends to concentrate in consumer discretionary and industrials, and to systematically underweight financials and the deep-value cyclicals that AVUV's book-to-price screen scoops up. Over a window that included the 2020–2021 small-cap value recovery and the 2022 rate shock, the cheap, profitable cyclicals AVUV held outran the cash-generative consumer names CALF favored. The non-obvious point: CALF's screen is often described as a "value" screen, but FCF-yield weighting is closer to a quality-and-cash tilt, and it loaded into different industries than a true book-value screen. The two funds are less substitutable than the shared "small-cap quality" label implies.
CALF and AVUV carried almost identical volatility over five years, but AVUV converted that risk into more than double the return — the gap is in what each screen owns, not how much risk it takes.
Realized risk and the single-regime problem
Both funds are deep-cyclical instruments. A 23% annualized volatility and a drawdown in the −29% to −34% range are not anomalies to be explained away; they are the baseline cost of owning the small end of the market. The drawdown chart below shows that neither fund offered much shelter in a stress event — the question for an allocator is depth and recovery duration, not whether a drawdown happens.
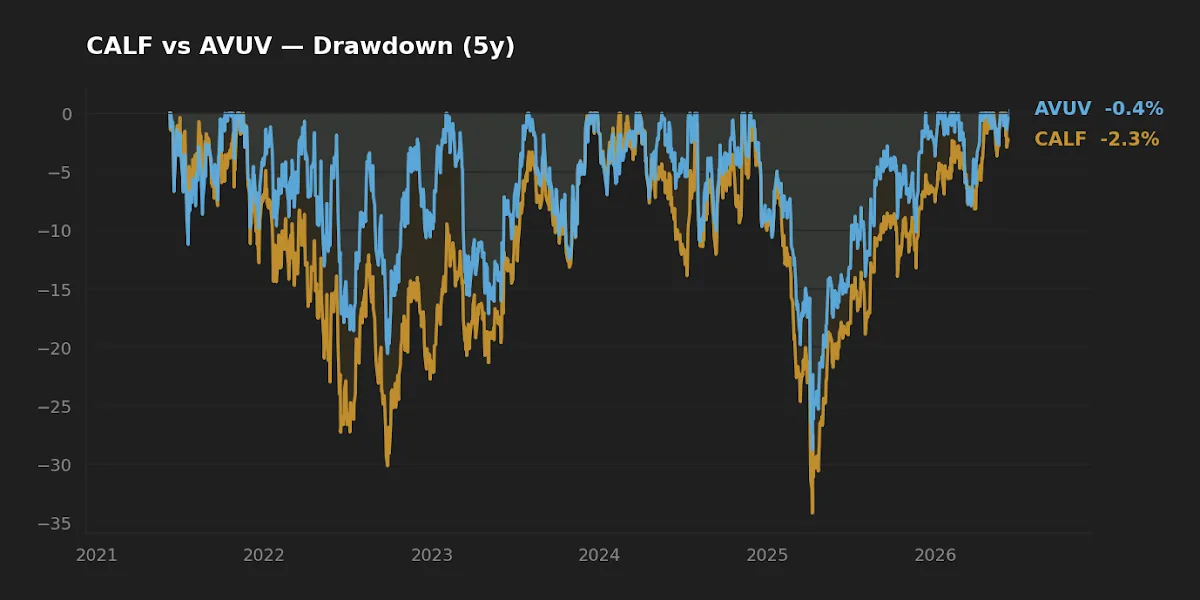
The honest caveat is that five years is one regime, not a sample of regimes. This window contained a pandemic crash, an extraordinary liquidity-driven recovery, an inflation shock, and a rate-hiking cycle — but it contained exactly one of each. AVUV's profitability screen happened to be well suited to the 2022–2023 environment; that is evidence, not proof, that it will lead across the next cycle. We are also reading this against a macro backdrop of a 3.63% fed funds rate and CPI still running near 3.9% year-over-year (FRED, asof 2026-05-01 and 2026-04-01), a regime that has not historically been kind to the most rate-sensitive small-caps. A different inflation and rate path could reorder these results. For a concrete look at how AVUV behaved under one acute stress event, see SCHD, AVUV, and VXUS During the Iran–U.S. War Shock.
Cost, capacity, and the implementation friction
The 34 basis-point fee gap (0.59% vs 0.25%) is the most certain number in this comparison. Past returns are a single draw; the cost differential is contractual and compounds every year. Over a multi-decade horizon, 34 bp of annual drag is a real and recurring headwind for CALF that has nothing to do with which screen is "smarter."
Scale matters in a less obvious way. AVUV runs $27.1B against CALF's $3.5B. For the underlying small-cap names, that is a double-edged fact: AVUV's size gives it tighter bid-ask spreads and trading efficiency, but it also constrains how aggressively a systematic manager can tilt into the smallest, least-liquid value names before market impact erodes the edge. CALF, smaller and rules-bound, rebalances mechanically and can hold concentrated positions, but its 100-stock construction and FCF-yield weighting produce higher turnover and more single-name concentration risk. Neither is strictly better; they are different capacity profiles. An investor should at least know that AVUV's size is part of why its tracking is smooth and part of why its future factor tilt may be gentler than a tiny fund could run.
Scoreboard
| Category | Winner | Why |
|---|---|---|
| Cost | AVUV | 0.25% vs 0.59% — a durable 34 bp edge |
| Realized risk | AVUV | Lower volatility (22.7%) and shallower drawdown (−28.8%) |
| Realized return | AVUV | 10.8% vs 4.2% 5Y CAGR |
| Suitability as standalone tilt | AVUV | Multi-factor screen is more diversified than a single-metric one |
| Distinctiveness / satellite role | CALF | FCF-yield screen offers genuinely different sector exposure |
FAQ
Are CALF and AVUV redundant if I hold both? Less than the labels suggest. CALF's free-cash-flow screen and AVUV's book-to-price-plus-profitability screen pull into different sectors, so the overlap in actual holdings is modest. They are not interchangeable, but they are also not fully independent — both are small-cap, both are cyclical.
Why did CALF underperform if free cash flow is a quality signal? Over this particular window, FCF-yield weighting concentrated in consumer and industrial names and underweighted the cheap financials and cyclicals that led the small-cap value recovery. The screen worked as designed; the design simply favored a part of the market that lagged.
Is the 0.59% expense ratio on CALF a dealbreaker? Not on its own — fees are only worth paying for differentiated exposure. The concern is paying 34 bp more for a screen that, over five years, delivered less than half the return at comparable risk. The cost is justified only if you specifically want CALF's distinct sector profile.
Does the short track record undermine the comparison? Partly. AVUV has existed only since 2019, so all figures here come from one regime. The cost gap is reliable; the return and risk gaps are a single, eventful sample and should be weighted accordingly.
How do these fit alongside a total-market core? Both are tilts, not cores. The academic literature on the size and value premia frames them as long-horizon, high-variance bets that can underperform for years. They belong in a satellite sleeve sized to a volatility you can hold through a −30% drawdown without selling.
What this comparison can and can't tell you
It can tell you the realized cost gap (certain), the realized five-year return and risk gap (one regime), and the structural differences in how each fund screens and where that led its sector exposure. It cannot tell you which screen wins across the next decade, how either behaves in a sustained high-rate small-cap bear market not seen in this window, or what happens to CALF's mechanical rebalancing if its AUM grows into the underlying names. Five years is a data point, not a distribution.
Scenarios where each fund fits
A reader in their 30s building a long-horizon small-cap value tilt inside a tax-advantaged account, who wants one diversified, low-cost holding and will not touch it for a decade, lands naturally on AVUV — the multi-factor screen and 0.25% fee are the more defensible default. A reader who already holds a book-value small-cap value fund and specifically wants a differentiated, cash-flow-driven sector exposure as a smaller satellite might add CALF — but with eyes open about the higher fee and the single-metric concentration. A reader who cannot stomach a −30% drawdown should hold neither at size.
Editor's read
If forced to choose one for the long-horizon small-cap sleeve, the editor leans clearly toward AVUV. The case is not the trailing return alone — five years is one regime — but the combination of a 34 bp permanent cost advantage, a multi-factor screen that is structurally more diversified than CALF's single FCF-yield metric, and the fact that it delivered its return at marginally lower realized volatility. CALF remains genuinely interesting as a small satellite for its distinct sector exposure, but as a core tilt the evidence favors the cheaper, broader screen.
Editor's holdings disclosure: the editor holds AVUV; does not hold CALF at the time of writing.
Methodology. Price, return, volatility, and drawdown figures from yfinance (daily adjusted close), pulled 2026-06-09, window covering the trailing five years. Expense ratio, AUM, inception, and screening methodology from issuer fact sheets (Pacer, Avantis), same date. Macro figures from FRED (fed funds rate asof 2026-05-01; CPI year-over-year asof 2026-04-01). Volatility is annualized from daily returns; max drawdown is peak-to-trough on cumulative total return.
This article is for educational purposes and does not constitute personalized financial advice. See full Disclaimer.