
Photo by Jakub Żerdzicki on Unsplash
The short version
- DGRO holds 400+ names with a lower 1.96% yield and a growth lean; SCHD holds roughly 100 with a 3.25% yield and a sharper value-quality tilt — same "dividend growth" label, two different factor bets.
- Over five years DGRO compounded faster (10.6% vs 8.4%), but over ten years the two nearly converge (13.3% vs 12.8%) — most of the recent gap is one regime, not a durable edge.
- Bottom line: DGRO suits an accumulator who wants breadth and a growth lean; SCHD suits an investor who wants a higher, more concentrated quality-yield stream and shallower drawdowns.
DGRO and SCHD both market themselves as dividend-growth funds, and both have become default holdings in retirement accounts. But they answer the same question — how do you own companies that raise their payouts? — in nearly opposite ways. One casts a wide net across more than four hundred names; the other runs a tight, rules-based screen down to around a hundred. The central question here is whether that breadth-versus-concentration choice actually changes outcomes, or whether it mostly changes the story you tell yourself.
Context: what each fund is actually buying
The iShares Core Dividend Growth ETF (DGRO) tracks an index of U.S. stocks with at least five consecutive years of dividend growth, screened on payout-ratio sustainability and weighted by dividend dollars. The result is a broad portfolio — over 400 holdings — that ends up closer to a quality tilt on the total market than to a pure yield play. The Schwab U.S. Dividend Equity ETF (SCHD) tracks the Dow Jones U.S. Dividend 100 Index, which requires ten years of dividend history and then ranks survivors on a composite of cash-flow-to-debt, return on equity, dividend yield, and dividend growth — keeping the top ~100. SCHD's methodology is stricter and its concentration higher, which pushes it toward value and toward larger, slower-growing payers.
That design difference shows up in the headline numbers. SCHD yields 3.25% against DGRO's 1.96% (issuer fact sheets, as of the data pull). The 129-basis-point yield gap is the most visible signature of the two screens: SCHD is built to harvest yield within a quality filter, while DGRO accepts a lower current yield in exchange for a faster-growing, broader payout base. For readers comparing where dividend strategies sit against cash, the prevailing fed funds rate was 3.63% (FRED, asof 2026-05-01) and headline CPI ran 3.9% year over year (FRED, asof 2026-04-01) — so even SCHD's yield only roughly matches short-term policy rates, and neither fund should be read as an income substitute for cash.
The data side by side
| Metric | DGRO | SCHD |
|---|---|---|
| Name | iShares Core Dividend Growth | Schwab U.S. Dividend Equity |
| Expense ratio | 0.08% | 0.06% |
| AUM | $40.5B | $94.9B |
| Dividend yield | 1.96% | 3.25% |
| Inception | 2014-06-10 | 2011-10-20 |
| 5Y CAGR | 10.6% | 8.4% |
| 10Y CAGR | 13.3% | 12.8% |
| 5Y volatility (annualized) | 13.8% | 14.4% |
| Max 5Y drawdown | -19.3% | -16.8% |
Source: yfinance for price, return, volatility, and drawdown (fetched 2026-06-09); issuer fact sheets for expense ratio, AUM, and yield — iShares DGRO and Schwab SCHD.
The 5-year gap is real, but read it carefully
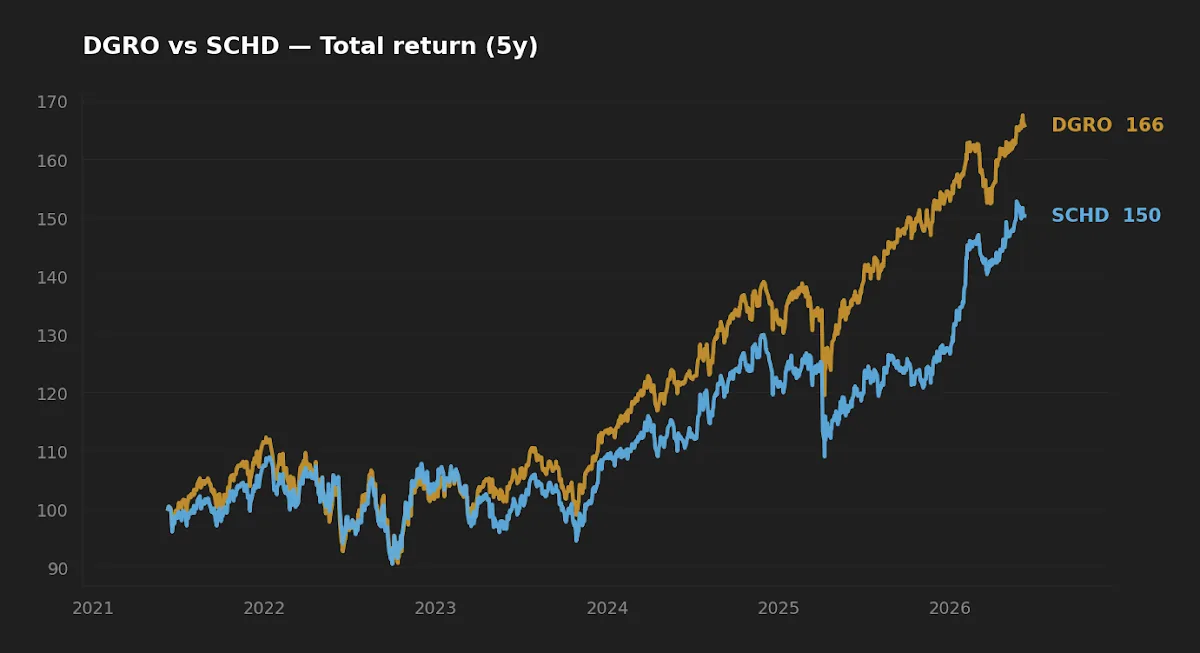
Over the trailing five years DGRO compounded at 10.6% against SCHD's 8.4% — a 2.2-percentage-point annual gap that the normalized return chart above makes visually obvious. Initially I read that as DGRO simply being the better fund. Then I looked at the ten-year figures: 13.3% versus 12.8%, a gap of barely half a point. The divergence is almost entirely a recent phenomenon.
The cleanest explanation is factor leadership, not fund quality. The last five years rewarded growth and the larger-cap, higher-multiple end of the market, and DGRO's lower yield and broader composition give it more exposure to exactly that. SCHD's stricter value-and-yield screen tilted it toward the part of the market that lagged in the same window. This is the look-ahead trap dressed up as analysis: pick the window where one factor won, and the fund tilted toward that factor looks structurally superior. The ten-year convergence is the more honest signal, and it says these are two competent expressions of the same idea whose ranking flips with the regime. Anyone extrapolating the 5-year line forward is, implicitly, betting that growth leadership continues — a real bet, but it should be made on purpose, not inherited from a backtest.
The five-year gap is not evidence that one screen is better — it is evidence of which factor won, and factors take turns.
Realized risk: concentration didn't cost what you'd expect
The intuitive story is that SCHD's ~100-name concentration should make it the riskier ride and DGRO's 400-plus breadth the smoother one. The realized data inverts that. SCHD's worst five-year drawdown was -16.8%, shallower than DGRO's -19.3%, even though their annualized volatilities are close (14.4% vs 13.8%). The drawdown chart below shows SCHD declining less in the deepest trough of the window.
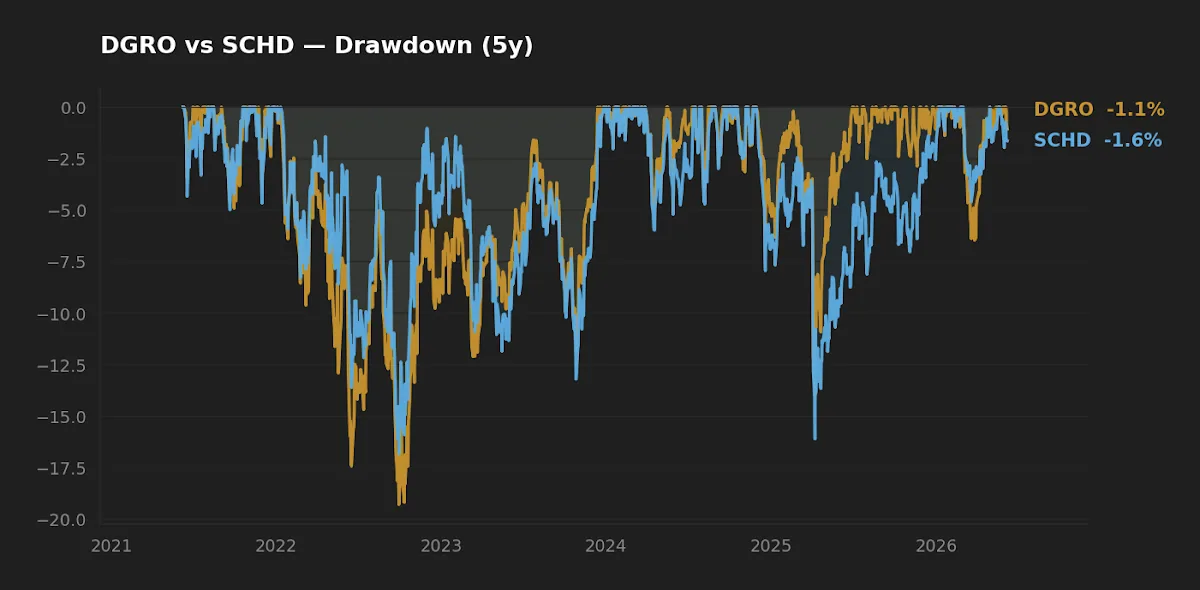
This is the non-obvious point. Breadth reduces single-name risk, but it does not reduce factor risk, and in a drawdown what usually matters is which factors you own, not how many tickers. SCHD's value-quality tilt and lower-multiple holdings cushioned the deepest decline because cheaper, higher-yielding stocks fell less when the higher-multiple end sold off. DGRO's growth lean — the same thing that drove its five-year outperformance — is also what deepened its trough. The two numbers are linked: you do not get DGRO's recent upside without accepting that its composition leans into the segment that falls harder when sentiment turns. SCHD's higher yield, meanwhile, returns capital along the way, which mechanically dampens drawdown depth on a total-return basis. None of this is a verdict — one observed trough is a small sample — but it should retire the idea that more holdings automatically means less pain.
Cost and capacity: a smaller story than the marketing suggests
On fees the two are nearly identical: 0.06% for SCHD against 0.08% for DGRO, a two-basis-point gap that compounds to almost nothing over decades and should not drive the decision. Both are cheap enough that cost is not the deciding variable here — a contrast with active dividend strategies, where expense ratios of 0.5% or more meaningfully erode the qualified-dividend advantage these funds are supposed to deliver.
Scale is the quieter difference. SCHD's $94.9B AUM is more than double DGRO's $40.5B. Both are large enough that bid-ask spreads and tracking error are non-issues for a buy-and-hold investor, and closure risk is negligible for either. The second-order effect of SCHD's size is its index reconstitution: when a fund this large rebalances a 100-name portfolio on a published schedule, its trades are large and somewhat anticipated, which can introduce modest reconstitution drag. DGRO's breadth and dollar-weighting make its turnover quieter. This is a small effect, not a thesis — but it is the kind of friction that breadth-versus-concentration discussions usually ignore entirely. For the broader question of how a quality-dividend screen behaves against a plain market-cap holding, the SCHD-versus-VOO total-return comparison is a useful companion, and the SCHD-versus-VIG factor analysis covers a closer DGRO-style peer.
Scoreboard
| Category | Winner | Why |
|---|---|---|
| Cost | SCHD (narrowly) | 0.06% vs 0.08% — immaterial in practice |
| Realized risk | SCHD | Shallower max drawdown (-16.8% vs -19.3%) |
| Realized return (5Y) | DGRO | 10.6% vs 8.4% CAGR — but regime-driven |
| Realized return (10Y) | Tie | 13.3% vs 12.8% — essentially equal |
| Current income | SCHD | 3.25% vs 1.96% yield |
| Suitability | Depends | Growth lean vs higher concentrated yield |
FAQ
Is DGRO just a higher-growth version of SCHD? Roughly, yes. DGRO accepts a lower 1.96% yield in exchange for broader exposure and a growth lean, while SCHD's stricter screen produces a 3.25% yield and a value-quality tilt. They are different factor expressions of the same dividend-growth idea, not a quality ranking.
Why did DGRO beat SCHD over five years but not ten? The five-year window favored growth and higher-multiple stocks, which DGRO holds more of. Over ten years, across more than one regime, the two nearly converge (13.3% vs 12.8% CAGR), suggesting the recent gap is factor leadership rather than a durable edge.
Does holding both make sense? There is meaningful overlap in large-cap dividend payers, so owning both mostly dilutes each fund's distinct tilt. An investor wanting both growth lean and higher yield is often better served picking one and pairing it with a separate, genuinely different sleeve rather than doubling up on overlapping dividend funds.
Which has the better income stream for a retiree? On current yield, SCHD (3.25% vs 1.96%) delivers more income today, and its shallower realized drawdown is relevant for someone drawing down. DGRO's faster payout growth may matter more for an accumulator with a long horizon. Neither yield, however, clearly exceeds the prevailing short-term policy rate.
How were these numbers calculated? Returns, volatility, and drawdown come from yfinance price history pulled 2026-06-09; expense ratio, AUM, and yield come from the iShares and Schwab fact sheets. CAGR is annualized total return over the stated trailing window. See related dividend-strategy analysis in the DIVZ-vs-SCHD-vs-NOBL comparison.
What this comparison can and can't tell you
The trailing windows here cover a specific and unusually growth-favorable stretch of market history. A five-year drawdown number reflects the one or two stress episodes that happened to fall inside the window — it is not a full distribution of what either fund could do in a prolonged value-led bear market or a 1970s-style inflation regime, neither of which appears in the sample. DGRO's ten-year record begins in 2014, so its long-run figure spans fewer regimes than SCHD's. Yields are point-in-time snapshots that move with price. Treat the convergence of the ten-year CAGRs as the most robust finding and the five-year divergence as the least.
Scenarios where each fund fits
Reader in their 30s, 401(k)-only, decades to compound, no need for current income → DGRO's breadth and growth lean align with a long accumulation horizon, where the lower yield is not a cost. Reader nearing or in retirement who values a higher, steadier income stream and shallower declines → SCHD's 3.25% yield and milder realized drawdown fit the drawdown phase better. Reader already holding a broad market fund like VOO and wanting a genuine tilt → SCHD's sharper value-quality factor adds more diversification than DGRO, which sits closer to the market. The five-ETF core logic in this portfolio rationale shows where a single dividend sleeve typically sits.
Editor's read
If forced to hold one in a long-term core sleeve, the editor leans toward SCHD — not because it won the backtest (it didn't), but because its higher concentrated yield, shallower realized drawdown, and sharper factor distinctiveness give it a clearer role alongside a broad-market holding. DGRO is the better pick for an accumulator who specifically wants a growth lean and is comfortable that its recent outperformance is, in part, a bet on growth leadership continuing. The honest read of the ten-year convergence is that this is a tilt decision, not a winner-and-loser decision.
The editor holds SCHD as part of a long-term core; does not hold DGRO at the time of writing.
Key takeaways
- Same label, different bets: DGRO is broad with a growth lean (1.96% yield); SCHD is concentrated with a value-quality tilt (3.25% yield).
- The five-year return gap (10.6% vs 8.4%) is largely regime-driven; ten-year CAGRs nearly converge (13.3% vs 12.8%).
- Concentration did not mean more pain — SCHD's drawdown was shallower (-16.8% vs -19.3%), because factor exposure drives drawdowns more than holding count.
- Fees (0.06% vs 0.08%) are immaterial; AUM scale and reconstitution behavior are the quieter differences.
- Choose on the tilt you want, not on the trailing-five-year line.
Methodology: price, total return, annualized volatility, and maximum drawdown computed from yfinance daily data pulled 2026-06-09, over trailing 5- and 10-year windows. Expense ratio, AUM, and dividend yield from iShares and Schwab issuer fact sheets. Macro figures from FRED (fed funds rate asof 2026-05-01; CPI year-over-year asof 2026-04-01).
This article is for educational purposes and does not constitute personalized financial advice. See the full Disclaimer.