Photo by Joachim Schnürle on Unsplash
The short version
- DBMF replicates a basket of trend-following hedge funds using regression; CTA runs its own multi-model trend engine layered on a Treasury collateral base. Same category, different machinery.
- DBMF carries the longer live record (since 2019), a 0.85% expense ratio, and a realized 8.1% five-year CAGR through a deep 2022 sleeve. CTA (since 2022) is cheaper at 0.75% but has too little live history to judge across a full cycle.
- Bottom line: both are diversifiers, not core holdings. The choice is between a transparent replication record and a newer in-house model with a thinner track.
Managed-futures trend strategies earn their place in a portfolio for one reason: their returns tend to arrive when equities are falling apart. The interesting question is not whether to hold trend — it is how a fund decides what a trend is. DBMF and CTA both sit in the managed-futures ETF aisle, both target the same crisis-alpha profile, yet they construct trend signals in fundamentally different ways. This piece compares the two on machinery, cost, and the realized risk the data will actually support.
Context: what these funds are trying to do
Trend-following (also called CTA, after "commodity trading advisor") takes long or short positions across equities, bonds, currencies, and commodities based on price momentum. When a market trends up, the strategy goes long; when it trends down, it flips short. The payoff is convex: small, frequent losses in choppy markets, occasional large gains when a sustained move develops. Because the strategy can be short stocks and bonds simultaneously, it has historically been one of the few liquid sources of positive return during equity drawdowns — 2008 and 2022 being the textbook cases.
The two ETFs here reach that profile by different routes. iMGP DBi Managed Futures Strategy ETF (DBMF) does not generate its own trend signals from scratch. It runs a regression that reverse-engineers the aggregate positioning of a pool of large managed-futures hedge funds, then replicates that exposure with a handful of liquid futures. The thesis: capture the category's beta while stripping out the 2-and-20 fee load. Simplify Managed Futures Strategy ETF (CTA) takes the more conventional path — it builds its own systematic trend models across asset classes and holds them on top of a short-Treasury collateral base, which is part of why its distribution yield looks elevated.
I went into this comparison expecting the replication-versus-direct-model distinction to be mostly cosmetic. It isn't. It changes what you are actually exposed to, and it changes how you should read the track record.
The data side by side
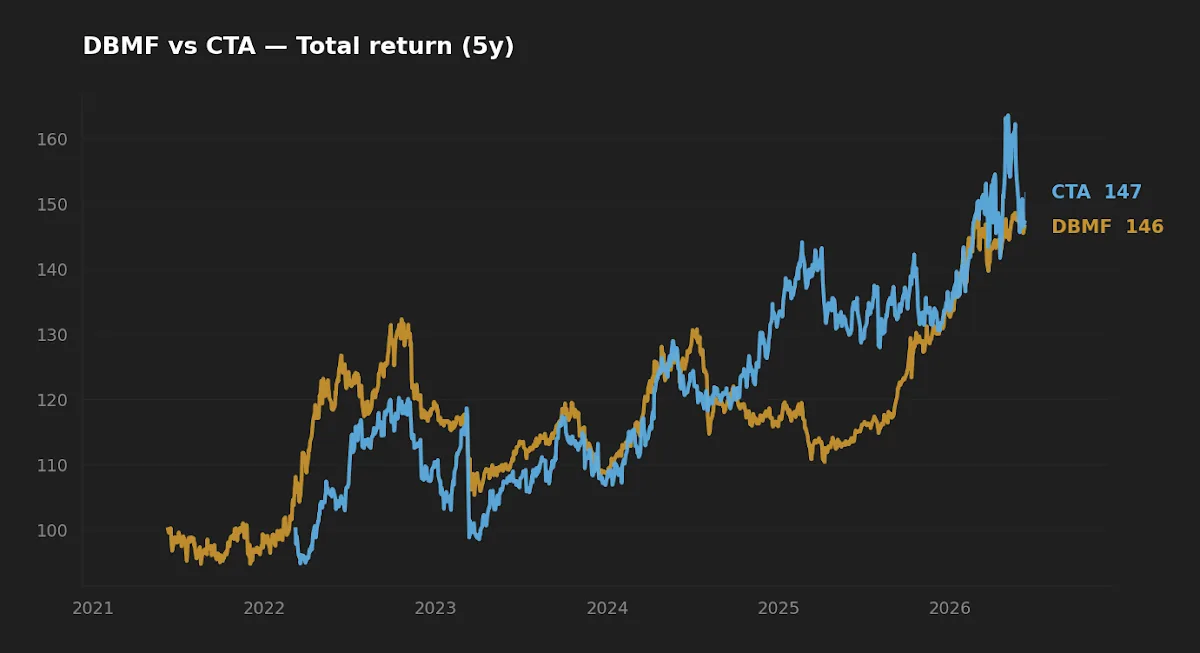
The table below uses price and return data pulled from yfinance on 2026-06-09. Expense ratios, AUM, and inception dates are from the issuer fact sheets (iMGP/DBi for DBMF; Simplify for CTA). Note the asymmetry that frames everything else: CTA launched in March 2022, so a clean five-year CAGR, volatility, and drawdown series simply do not exist for it yet.
| Metric | DBMF | CTA |
|---|---|---|
| Name | iMGP DBi Managed Futures Strategy | Simplify Managed Futures Strategy |
| Expense ratio | 0.85% | 0.75% |
| AUM | $3.9B | $1.6B |
| Inception | 2019-05-07 | 2022-03-07 |
| Distribution yield | 5.2% | 5.1% |
| NAV (2026-06-09) | $30.64 | $29.04 |
| 5Y CAGR | 8.1% | n/a (insufficient history) |
| 5Y annualized volatility | 12.5% | n/a |
| 5Y max drawdown | −20.4% | n/a |
A note on the yields. Both funds report distribution yields above 5%, but that figure does not represent a dividend in the equity sense. Managed-futures ETFs hold most of their assets in cash and Treasury collateral; with the fed funds rate at 3.63% (FRED, asof 2026-05-01), that collateral throws off meaningful interest income, which is distributed and shows up as "yield." Reading it as an income stream comparable to a dividend ETF would be a category error — the collateral yield is incidental to the trend strategy, not the point of it.
How they pick trends differently
This is the heart of the comparison, and it is where the two funds diverge from being interchangeable line items.
DBMF's replication approach means it is, in effect, a follower of the consensus CTA book. Each period it estimates which exposures best explain the recent returns of the largest trend managers, then matches them. The advantage is humility about its own forecasting: it does not claim to know the trend better than the aggregate of well-resourced funds — it just rents their positioning cheaply. The cost is a structural lag. Regression on trailing returns means DBMF tends to arrive at a position slightly after the managers it tracks, and it captures the average of the pool, which smooths away both the best and worst individual models. The replication mechanics are worth understanding in detail, and I walked through them separately in this DBMF deep dive.
CTA generates signals directly. Simplify's models look at price trends across multiple lookback windows and asset classes and size positions according to their own conviction and volatility estimates. There is no intermediary pool being copied — the fund's return is the output of its own rule set. That removes the replication lag but introduces single-model risk: if the in-house trend logic is mis-specified for a given regime, there is no diversifying pool of managers to average it back toward the mean. You are exposed to one team's signal design rather than the category's collective behavior.
The practical consequence is that DBMF and CTA can hold meaningfully different books at the same moment, even though both call themselves trend funds. In a sharp reversal, the replication fund's lag can hurt; in a sustained clean trend, a direct model with tighter signals can capture more of the move. Neither dominates — they fail and succeed under different conditions.
Both call themselves trend funds, but one rents the consensus book and the other builds its own — so in a sharp reversal they can be positioned on opposite sides of the same market.
Realized risk: what the live record actually shows
Here the history gap is decisive. DBMF has logged a 12.5% annualized volatility and a −20.4% maximum drawdown over the trailing five years (yfinance, 2026-06-09). That drawdown is instructive: it occurred largely in the choppy, trendless stretches where trend-following bleeds — not during an equity crash. It is the price of admission for the convex payoff, and it is well within the historical range for the strategy. The drawdown profile below shows the shape of that experience.
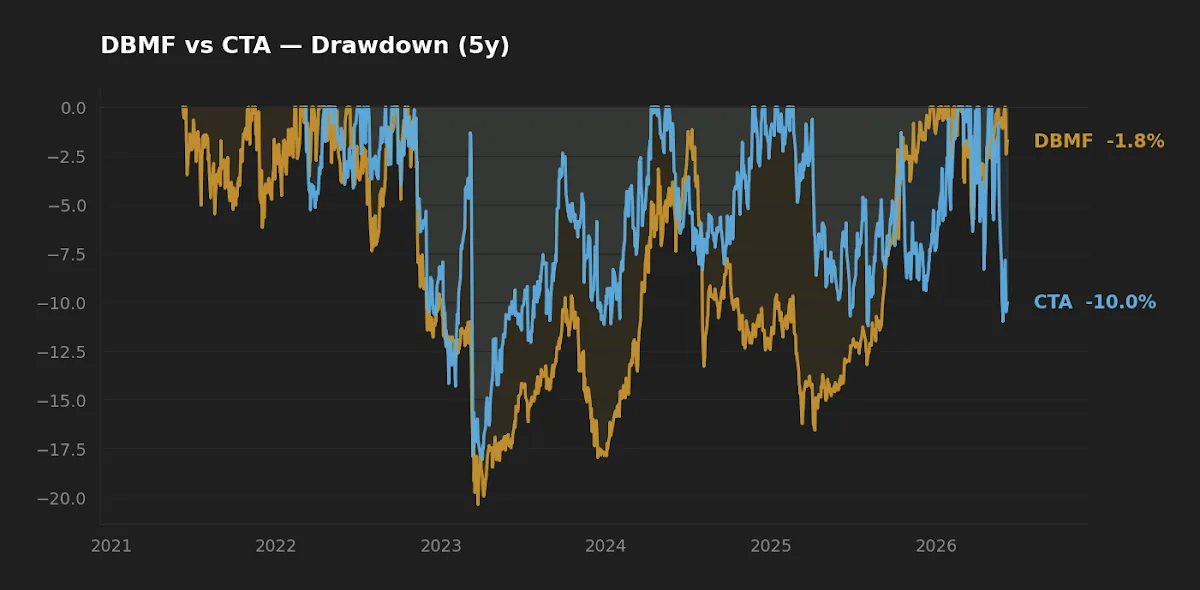
CTA has no five-year series to report — it has been live for roughly four years, and that window has been dominated by a single broad regime: the 2022 rate-shock environment in which trend did unusually well, followed by a more mixed period. That matters more than it first appears. A fund that came of age during trend's best modern year will show a flattering early record, and a naive reading of "CTA looks strong since launch" risks mistaking favorable regime timing for durable edge. We simply do not yet have a trendless, range-bound stretch long enough to stress CTA's models the way DBMF's −20.4% drawdown stressed its replication. Until that data exists, the honest comparison is asymmetric: one fund has been observed across more of the cycle than the other.
This is the non-obvious point worth sitting with. The thing that makes CTA look attractive — a clean record concentrated in trend-friendly years — is also the reason its record cannot yet be trusted as evidence of skill. The very tailwind that produced the numbers is what disqualifies them as a full-cycle test.
Cost, scale, and implementation friction
The headline fee gap is small: DBMF at 0.85% versus CTA at 0.75%, a 0.10% difference. Over decades, basis points compound, and 10 bp is not nothing — but in this category it is second-order. Managed-futures returns swing far more on signal design and regime than on a tenth of a percent of fee. Both expense ratios are reasonable relative to the 2-and-20 structures these funds are designed to replace; that displacement of hedge-fund fees is most of the cost story, and I covered the broader shift in how systematic strategies are displacing traditional hedge funds.
Scale tilts the other way. DBMF's $3.9B in assets versus CTA's $1.6B gives it tighter secondary-market liquidity and a thinner closure risk — relevant for a strategy that is already niche. Neither fund is small enough to worry about bid-ask spread for a long-term holder sizing a modest sleeve, but the larger, longer-lived fund carries less operational tail risk. One more implementation note: both are actively managed strategies whose distributions include collateral interest taxed as ordinary income, so the realized tax-cost ratio in a taxable account will be higher than the headline yield suggests. These belong in tax-advantaged space where possible.
Scoreboard
| Category | Edge | Why |
|---|---|---|
| Cost | CTA | 0.75% vs 0.85% — a real but second-order 10 bp gap |
| Realized risk (observed) | DBMF | Five-year vol and drawdown are documented; CTA's are not yet measurable across a cycle |
| Realized return (observed) | DBMF | 8.1% 5Y CAGR is a full-window number; CTA's record is regime-flattered and short |
| Scale / durability | DBMF | $3.9B AUM and a 2019 inception lower closure and liquidity risk |
| Signal independence | Even | Replication lag vs single-model risk — different failure modes, no clear winner |
Frequently asked questions
Are DBMF and CTA substitutes for each other? Functionally similar in goal, different in construction. DBMF replicates a pool of hedge funds; CTA runs its own models. Holding both would diversify across methodologies but would also double an allocation to a single niche strategy, so most portfolios would choose one.
Why do both yield over 5% if they aren't income funds? The yield is collateral interest. These funds hold cash and Treasuries as margin for their futures positions, and with the fed funds rate at 3.63% (FRED, asof 2026-05-01) that collateral generates substantial interest, which is distributed. It is not a dividend and should not be compared to one.
Why is there no 5-year data for CTA? CTA launched on 2022-03-07, so it has only about four years of live history. A clean five-year CAGR, volatility, and drawdown series cannot be computed yet, and the history it does have is concentrated in a trend-favorable regime.
Do these funds help during a stock market crash? Historically, trend-following has produced positive returns during sustained equity declines because it can hold short positions. The benefit is real but conditional — it depends on the decline being a sustained trend rather than a sharp, choppy reversal, where trend strategies can lag or lose.
How large a position makes sense? That is a portfolio-construction question specific to each investor, and not something this article can answer for you. The general literature treats managed futures as a diversifying satellite rather than a core holding, given its concentrated strategy risk and reliance on a single return driver.
Key takeaways
- DBMF and CTA pursue the same crisis-alpha profile through different machinery — replication of a hedge-fund pool versus an in-house trend model — and can hold opposite positions in the same market.
- DBMF's five-year record (8.1% CAGR, 12.5% volatility, −20.4% max drawdown) spans more of a full cycle; CTA's shorter history is concentrated in a trend-favorable regime and cannot yet be read as evidence of skill.
- The 0.10% fee gap favors CTA but is second-order in a category where signal design and regime dominate returns.
- The 5%+ yields are collateral interest, not dividends, and are taxed as ordinary income — these strategies fit tax-advantaged accounts better than taxable ones.
- Both are diversifying satellites, not core holdings; the realistic choice is between a longer, transparent replication record and a newer model with a thinner, regime-flattered track.
Methodology: price, return, volatility, and drawdown figures from yfinance, pulled 2026-06-09, over the trailing five-year window where available. Expense ratio, AUM, and inception from issuer fact sheets (iMGP/DBi, Simplify). Macro figures from FRED (fed funds rate asof 2026-05-01; CPI year-over-year asof 2026-04-01). CTA's five-year statistics are unavailable because the fund's 2022-03-07 inception predates a full five-year window.
This article is for educational purposes and does not constitute personalized financial advice. See the full Disclaimer.