Photo by David Todd McCarty on Unsplash
The short version
- The last five years rewarded cash (SGOV) and punished duration (BND) — but that record was set during a rate-hiking regime, and it is the wrong template for a falling-rate path.
- SGOV carries almost no duration, so it captures almost none of the price gain when yields fall; BND carries roughly six years of duration, which cuts both ways.
- Bottom line: SGOV is a reinvestment-risk instrument and BND is a duration instrument. The choice is about which risk you want, not which one "won" in the backtest.
If the Fed continues to ease through 2026, the most common portfolio question becomes deceptively simple: should the defensive sleeve sit in ultra-short Treasury cash like the iShares 0-3 Month Treasury Bond ETF (SGOV), or in a duration-bearing core like the Vanguard Total Bond Market ETF (BND)? The trailing five-year numbers seem to settle it — and they settle it in exactly the wrong direction. This article works through why.
Context: what each fund actually is
SGOV holds Treasury bills maturing in zero to three months. Its weighted duration is a rounding error, so its price barely moves; the return arrives almost entirely as monthly income that tracks the front of the curve. When the Fed cuts, that income resets down within weeks. BND holds the broad U.S. investment-grade bond market — Treasuries, agency MBS, and investment-grade credit — at an average duration near six years. Duration is the lever: a one-percentage-point fall in yields lifts BND's price by roughly six percent, and a one-point rise costs about the same.
The macro backdrop matters here. The effective federal funds rate stood at 3.63% (FRED, asof 2026-05-01), down from the cycle peak, while headline CPI was still running at 3.9% year over year (FRED, asof 2026-04-01). A Fed easing into above-target inflation is not the clean disinflationary cutting cycle that bond bulls like to picture — which is precisely why the cash-versus-duration question deserves more than a glance at past returns. For the broader rate-cut picture, see our earlier piece on what happens to stocks, bonds, and gold in a 2026 cutting cycle.
The data
| Metric | SGOV | BND |
|---|---|---|
| Name | iShares 0-3 Month Treasury Bond ETF | Vanguard Total Bond Market ETF |
| Expense ratio | 0.09% | 0.03% |
| AUM | $91.9B | $394.4B |
| SEC / distribution yield | 3.9% | 3.9% |
| Inception | 2020-05-26 | 2001-11-12 |
| 5Y CAGR | 3.5% | 0.1% |
| 10Y CAGR | n/a (post-2020) | 1.7% |
| 5Y annualized volatility | 0.2% | 6.0% |
| 5Y max drawdown | -0.03% | -17.9% |
Price/return figures are from yfinance (pulled 2026-06-09); expense ratio, AUM, and mandate are from the issuer fact sheets — iShares for SGOV and Vanguard for BND. Note that the two funds report a near-identical yield today (3.9% each), which is itself a snapshot of the inverted-then-flattening curve, not a structural feature.
Why the five-year scoreboard is a trap
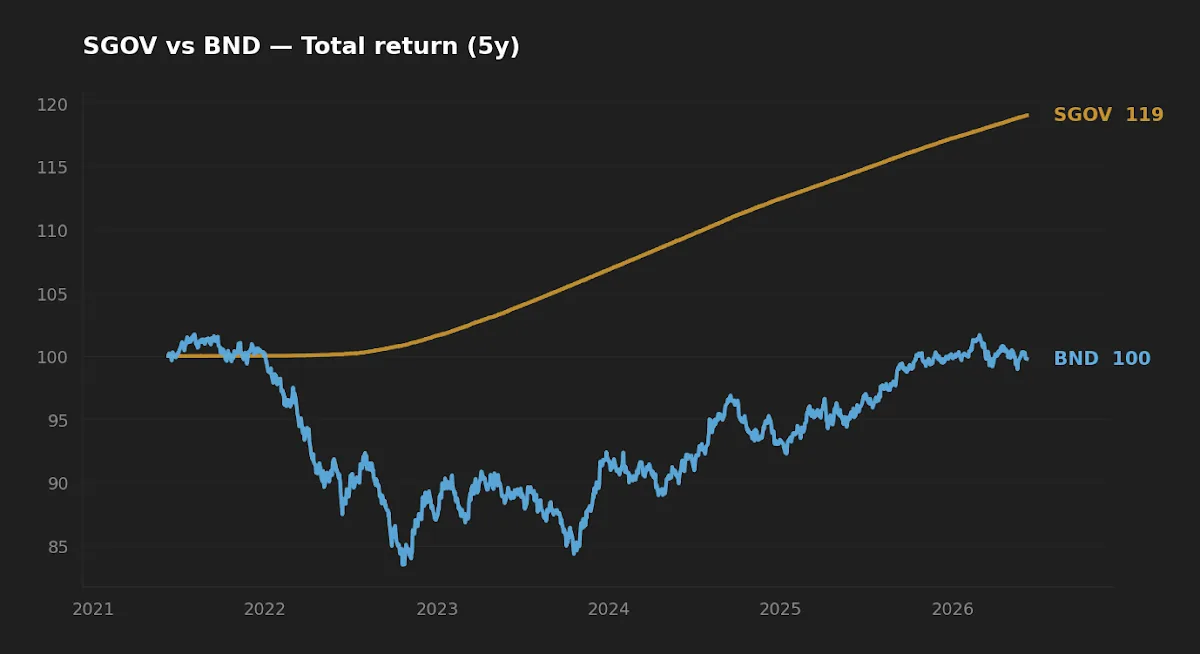
SGOV compounded at 3.5% a year over five years; BND returned essentially nothing (0.1%). Taken at face value, that is a rout. But look at the window. SGOV's live history begins in May 2020 and runs straight through the most aggressive hiking campaign in four decades. Rising yields are mechanical poison for duration and a mechanical tailwind for cash that reprices upward every month. The backtest didn't discover that cash is better than bonds; it documented one regime in which cash was better than bonds.
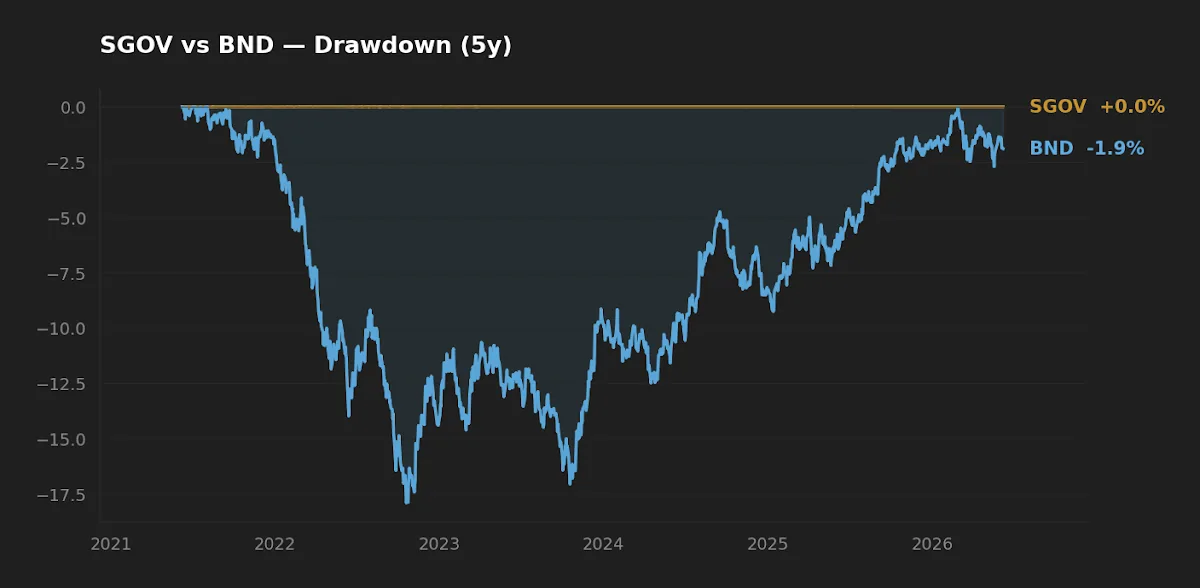
This is the look-ahead and single-regime problem stated plainly. A reader sizing a defensive sleeve for a falling-rate path who anchors on this five-year record is extrapolating the exact dynamic that is about to reverse. BND's -17.9% drawdown was the cost of holding duration into a hiking cycle. The other side of that same coin — the price gain duration delivers when yields fall — is what the trailing data structurally cannot show, because it hasn't happened yet in this sample.
The backtest didn't discover that cash beats bonds. It documented one regime in which it did — and that regime is the one a rate-cut path unwinds.
Realized risk: two completely different shapes
The volatility figures are not close. SGOV's annualized standard deviation over five years was 0.2%; BND's was 6.0% — a factor of roughly thirty. SGOV's worst peak-to-trough decline was -0.03%, which is to say it never meaningfully fell. BND lost nearly a fifth of its value over the same span and is still climbing back. These are not two points on a smooth risk-return line; they are two different instruments answering two different questions. SGOV answers "where do I park capital I may need soon without market risk?" BND answers "where do I hold a long-horizon ballast that can appreciate when the economy weakens and yields fall?"
The asymmetry the trailing data hides
Here is the one second-order effect that should drive the decision. SGOV carries no duration but it carries full reinvestment risk: every month, maturing bills roll into new bills at whatever the front of the curve now offers. In a cutting cycle, that yield falls in near-real-time. The 3.9% SGOV pays today is not a rate you lock in; it is a rate you re-bid every few weeks, downward, as the Fed eases. BND, by contrast, holds coupons set at issuance across a six-year ladder. As rates fall, BND keeps collecting yesterday's higher coupons and books price appreciation on the way down.
So the relationship inverts with the rate path. In a hiking or higher-for-longer regime, SGOV's repricing is a feature and BND's duration is a liability — the five-year record. In a sustained easing regime, SGOV's repricing becomes the liability and BND's locked-in duration becomes the feature. The honest version of the comparison is not "which is better" but "which risk are you choosing": mark-to-market risk now (BND) versus the risk of reinvesting tomorrow's cash at a lower rate (SGOV). Initially I expected the cost gap to be the swing factor here. It isn't — the 0.06% expense difference is real and compounds, but it is an order of magnitude smaller than the duration decision sitting on top of it.
One caveat that keeps the easing case honest: with CPI still near 3.9%, the Fed's room to cut is constrained. If inflation forces a pause or a partial reversal, BND's duration becomes a liability again. That is the regime risk the bond case carries and SGOV does not. For more on holding cash deliberately rather than by default, see our note on SGOV's role as a portfolio cash floor.
Scoreboard
| Category | Winner | Why |
|---|---|---|
| Cost | BND | 0.03% vs 0.09% — a 0.06% edge that compounds |
| Realized risk (5Y) | SGOV | 0.2% volatility, -0.03% max drawdown vs BND's 6.0% / -17.9% |
| Realized return (5Y) | SGOV | 3.5% vs 0.1% — but regime-specific to a hiking cycle |
| Forward fit for a rate-cut path | BND | Duration converts falling yields into price gains; SGOV's yield resets down |
Frequently asked questions
Is SGOV "risk-free" because its drawdown was only -0.03%? No. SGOV has minimal mark-to-market risk, but it carries full reinvestment risk — its income falls as the Fed cuts. The flat price line hides a yield that is not contractually yours beyond the next bill roll.
Why did BND return almost nothing over five years if bonds are supposed to be safe? Because the window (2020–2025) overlapped a steep hiking cycle, and rising yields push bond prices down. The -17.9% drawdown reflects duration meeting rising rates, not credit losses — BND is overwhelmingly Treasuries, agencies, and investment-grade credit.
If yields fall, roughly how much could BND gain on price alone? With duration near six years, a one-percentage-point decline in yields implies roughly a six-percent price gain, on top of coupon income. The same math applies in reverse if yields rise, which is the core asymmetry to weigh.
Do I have to choose just one? No. Many long-horizon allocations hold both: SGOV for capital needed within a year or two, BND for the duration ballast that can appreciate in a downturn. They hedge different risks rather than substitute for each other.
Does the 0.06% expense gap matter? It compounds and is worth noting — basis points add up over decades — but it is far smaller than the duration decision. Choosing between these funds on fee alone would be optimizing the wrong variable.
What this comparison can and can't tell you
It can tell you the realized cost, risk, and return of each fund across one specific five-year window, and it can describe how duration mechanically behaves when yields move. It cannot tell you what the Fed will actually do, whether inflation lets it ease, or where the ten-year yield settles — those inputs were unavailable in this data pull and are unknowable in advance. SGOV's live history is also short (inception 2020), so its sample covers essentially one regime. Treat the forward case as conditional on a rate path, not as a forecast.
Scenarios where each fits
A reader holding cash earmarked for a near-term purchase, or who wants zero mark-to-market noise in a defensive sleeve, is describing SGOV's job. A reader building a long-horizon core who wants an asset that can appreciate when growth slows and the Fed eases — accepting interim price swings — is describing BND's job. An investor uncertain on the rate path can hold both and let the cash sleeve fund opportunistic duration adds if yields back up.
Editor's read
For a sleeve sized specifically against a 2026 rate-cut path, the editor leans toward giving BND a defined role rather than parking everything in cash: duration is the only one of these two that turns falling yields into a gain, and the five-year scoreboard that favors SGOV is a hiking-cycle artifact that does not generalize forward. The reservation is inflation — with CPI near 3.9%, the easing case is conditional, so SGOV keeps its place as the near-term cash floor rather than being replaced.
Disclosure: the editor holds SGOV as a cash floor and holds a broad bond allocation in the long-term core at the time of writing.
Methodology: Price and return series (CAGR, volatility, drawdown, NAV, yield) from yfinance, pulled 2026-06-09; five-year window for both funds, with BND's ten-year CAGR where available. Expense ratio, AUM, and mandate from issuer fact sheets (iShares, Vanguard). Macro figures from FRED — effective federal funds rate asof 2026-05-01, CPI year-over-year asof 2026-04-01.
This article is for educational purposes and does not constitute personalized financial advice. See our full Disclaimer.