Photo by Egor Komarov on Unsplash
The short version
- The fee gap is one basis point (VGT 0.09%, XLK 0.08%), not the ten the headline framing usually implies — cost is not where these two funds actually diverge.
- The real difference is index construction: XLK holds only S&P 500 technology names, while VGT reaches down into mid- and small-cap tech through a broader IMI index.
- Over five years XLK's tighter mega-cap weighting led; over ten years the two are within seven basis points of each other — the breadth premium shows up only across the longer window.
The original framing of this comparison promised a 0.10% fee gap and a story about where that money goes. The data does not support it. As of the issuer fact sheets, VGT carries a 0.09% expense ratio and XLK an 0.08% one — a one-basis-point difference, not ten. That correction matters, because it forces the analysis onto the question that actually distinguishes these two funds: how each one defines "the technology sector," and what that definition does to a long-horizon holder's realized return and risk.
Both are among the largest technology ETFs in existence, both are passive, both are cheap. If cost were the deciding variable, this would be a coin flip. It isn't a coin flip — but the reason has nothing to do with the expense line.
Context: two different definitions of "tech"
XLK is the State Street Technology Select Sector SPDR, launched in December 1998. It tracks the Technology Select Sector Index, which draws its constituents only from companies already in the S&P 500 and classified as information technology under GICS. That is a large-cap-only universe by construction — roughly 65–70 holdings, market-cap weighted, with the mega-caps dominating.
VGT is the Vanguard Information Technology Index Fund ETF, launched in March 2004. It tracks the MSCI US Investable Market Information Technology 25/50 Index — an IMI ("Investable Market Index") that spans large, mid, and small caps. The result is a portfolio of several hundred holdings. The mega-caps still dominate the top of the book, but the long tail of mid- and small-cap technology names is present in VGT and absent in XLK.
One further wrinkle sits underneath both: the "25/50" in each index name refers to the RIC diversification rules that cap how much weight a single holding (25%) and the sum of all 5%-plus holdings (50%) can carry. In a sector this concentrated, those caps are not academic — they have, in past rebalances, forced both indices into weighting outcomes that look counterintuitive relative to raw market cap. That is worth filing away before reading the return numbers.
The data
| Metric | VGT | XLK |
|---|---|---|
| Expense ratio | 0.09% | 0.08% |
| AUM | $170.1B | $124.5B |
| Inception | 2004-03-25 | 1998-12-16 |
| Dividend yield | 0.3% | 0.4% |
| 5Y CAGR | 21.1% | 22.5% |
| 10Y CAGR | 25.0% | 24.9% |
| 5Y annualized volatility | 25.3% | 25.1% |
| 5Y max drawdown | -35.1% | -33.6% |
Price and return figures: yfinance, fetched 2026-06-09. Expense ratio, AUM, yield, and inception: issuer fact sheets — Vanguard VGT and SPDR XLK. CAGR is trailing total return annualized over the stated window; drawdown is the largest peak-to-trough decline within the trailing five years.
Where the breadth shows up — and where it doesn't
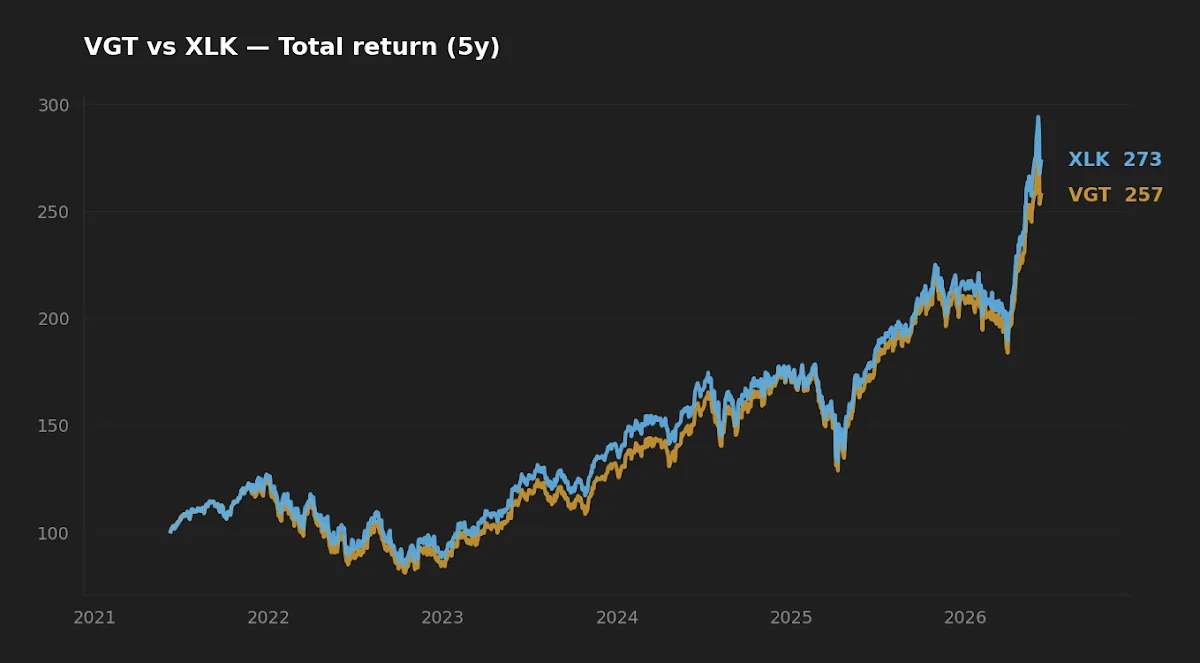
The five-year numbers favor XLK: 22.5% versus 21.1% annualized, a 1.4-point gap. The intuition that smaller-cap technology should add return over a full cycle would predict the opposite, so it is worth being honest about what happened. Over this particular five-year window, mega-cap technology — the names that dominate both funds but carry even more weight in XLK's narrower book — outran the mid- and small-cap tail. VGT's breadth was a drag, not a premium, because the breadth pointed at the part of the market that lagged.
Then look at the ten-year row: 25.0% for VGT against 24.9% for XLK. Seven basis points. Across the longer window the funds are, for practical purposes, indistinguishable. The mid/small sleeve that hurt VGT over five years contributed enough over ten to close the gap. This is the asymmetry the headline number hides: the "winner" depends entirely on which window you measure, and the dispersion between two funds that are 95%+ correlated comes almost entirely from a single design choice — universe breadth — interacting with whichever cap tier happened to lead.
Initially I expected VGT's wider universe to show up as a structural return edge over the decade. It didn't. It showed up as window-dependent noise around a shared mega-cap core. That is a more honest description of what an investor is choosing between here: not "more return" versus "less," but "a slightly wider net" versus "a slightly tighter one," with the outcome determined by factors no one can forecast in advance.
These funds do not differ on cost; they differ on how much of the technology sector you are willing to leave out — and over ten years that choice was worth seven basis points.
Realized risk
The risk profiles are nearly identical. Five-year annualized volatility comes in at 25.3% for VGT and 25.1% for XLK — a quarter of a point apart, which is inside the margin of measurement noise. Maximum drawdown over the same window was -35.1% for VGT and -33.6% for XLK. XLK drew down slightly less, consistent with its tilt toward the largest, most liquid names, but a holder of either fund lived through roughly a one-third peak-to-trough decline.
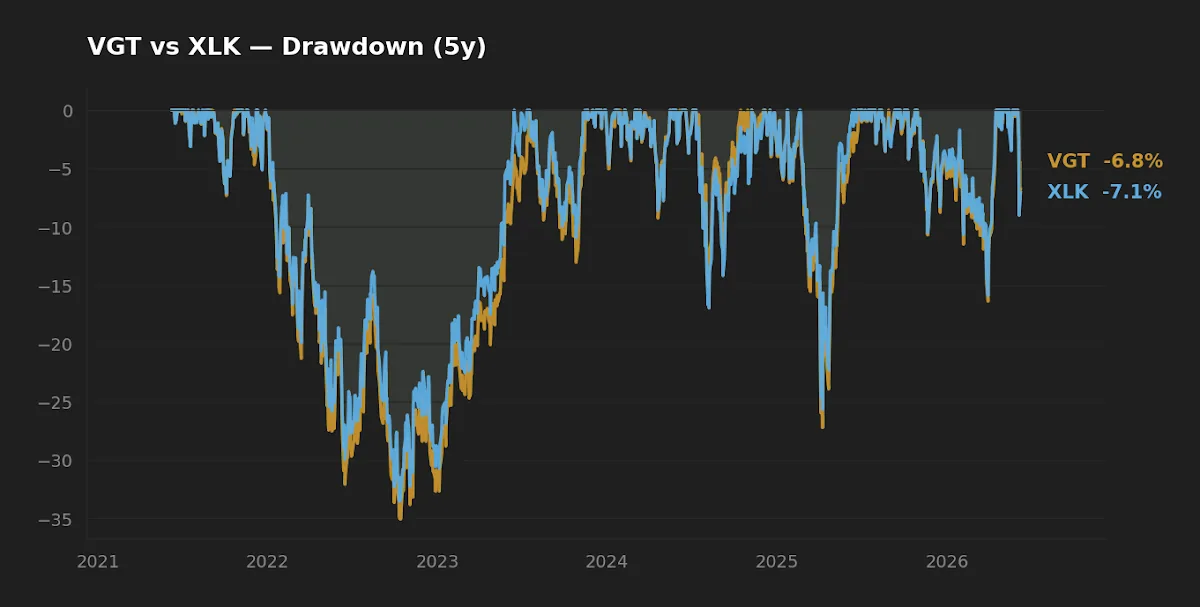
The number that deserves emphasis is not the gap between the two funds but the level both share. A 35% drawdown in a single-sector fund is the price of admission, and it is materially deeper than a broad-market index would have delivered over the same stress. Neither VGT nor XLK is diversified in any meaningful sense — both are concentrated bets on one sector, and the top handful of holdings drive the bulk of the variance. The behavioral question for a long-horizon holder is not which fund draws down less; it is whether you can hold a one-third decline without selling. The same discipline that matters for leveraged products applies, in milder form, to concentrated sector funds.
Scale, liquidity, and the macro backdrop
VGT is the larger fund at $170.1B versus XLK's $124.5B, and both are deep enough that bid-ask spreads and capacity are non-issues for any individual investor. At this scale, the implementation friction that can quietly erode returns in smaller, thinner ETFs simply doesn't apply here. Tracking error against the respective indices is minimal for both, and neither faces meaningful closure risk.
Worth holding in view: the macro regime in which these returns were earned. The effective federal funds rate sits at 3.63% (FRED, asof 2026-05-01) and CPI is running at 3.9% year over year (FRED, asof 2026-04-01) — a still-elevated-rate, still-above-target-inflation backdrop. Long-duration growth equities, which is functionally what both of these funds hold, are sensitive to the discount rate. The 21–25% annualized returns in the table were earned partly through a period of falling rates earlier in the window; a higher-for-longer path would compress the multiple expansion that drove a good share of those gains. The data tells us what happened. It does not promise the regime repeats. For the broader question of how a concentrated tech sleeve fits alongside other holdings, the quarterly framework review walks through the sizing logic.
Scoreboard
| Category | Edge | Note |
|---|---|---|
| Cost | XLK (marginal) | 0.08% vs 0.09% — one basis point, immaterial |
| Realized risk | XLK (marginal) | -33.6% vs -35.1% drawdown; volatility a tie |
| Realized return | Split | XLK over 5Y, dead heat over 10Y |
| Breadth / suitability | VGT | Mid/small-cap tech exposure XLK lacks |
FAQ
Is the fee difference between VGT and XLK actually 0.10%?
No. Per current issuer fact sheets, VGT charges 0.09% and XLK charges 0.08% — a one-basis-point gap. Any framing built around a ten-basis-point fee difference is outdated or incorrect.
Why does XLK hold fewer stocks than VGT?
XLK draws only from S&P 500 technology companies, so its universe is large-cap by construction. VGT tracks a broader Investable Market index that includes mid- and small-cap technology names, producing a portfolio several times larger in holding count.
Which one performed better?
It depends on the window. Over the trailing five years XLK led (22.5% vs 21.1% CAGR). Over ten years the two were within seven basis points (25.0% VGT vs 24.9% XLK). Neither holds a durable structural edge in the data.
Do these funds count as diversified holdings?
No. Both are single-sector funds concentrated in a small number of mega-cap technology names, and both experienced roughly a 35% drawdown over the past five years. They are sector bets, not diversifiers.
Does owning both VGT and XLK add anything?
Very little. The two are highly correlated and share the same mega-cap core; holding both mostly duplicates exposure while adding a small slice of VGT's mid/small-cap tail. The decision is better framed as one or the other.
Key takeaways
- The real fee gap is one basis point, not ten — cost is not a deciding factor between these two.
- The genuine difference is index breadth: XLK is S&P 500 tech only; VGT adds mid- and small-cap technology.
- XLK led over five years; the two were a virtual tie over ten — the "winner" is window-dependent.
- Risk is nearly identical, and both delivered ~35% drawdowns; these are concentrated sector funds, not diversified core holdings.
- Returns were earned in a falling-rate stretch within a still-elevated-rate regime (Fed funds 3.63%, CPI 3.9%, FRED) — past CAGR is not a forecast.
Editor's read
If forced to pick one for a satellite technology tilt, the editor leans marginally toward VGT — not for its return history, which is a wash over the decade, but because its broader universe is the more complete expression of "the technology sector," and the one-basis-point cost difference is not worth surrendering that breadth. XLK is the cleaner choice for an investor who specifically wants only the mega-cap leaders. Either way, the position belongs sized as a concentrated satellite, not a core holding, given the shared ~35% drawdown profile.
Holdings disclosure: the editor does not hold either VGT or XLK at the time of writing.
Methodology: Price and total-return series via yfinance, pulled 2026-06-09; CAGR, volatility, and drawdown computed over trailing 5- and 10-year windows. Expense ratio, AUM, dividend yield, and inception from issuer fact sheets (Vanguard, SPDR), same date. Macro figures from FRED (Fed funds asof 2026-05-01; CPI asof 2026-04-01). Single-regime caveat applies: a five-to-ten-year window captures one broad macro environment and cannot stand in for how either fund behaves across all conditions.
This article is for educational purposes and does not constitute personalized financial advice. See our full Disclaimer.