Photo by Markus Spiske on Unsplash
The short version
- Over the trailing five and ten years, XLF and VFH delivered almost identical returns and drawdowns — the 1 basis point fee gap and the difference in holdings count barely register.
- VFH holds roughly five times as many names as XLF, but both are cap-weighted and dominated by the same mega-cap banks, so the extra breadth adds tracking noise more than genuine diversification.
- Bottom line: the choice is closer to a coin flip than the "which financials ETF wins the rate-cut cycle" framing suggests — construction, not the macro headline, is the real decision.
The financial sector attracts a particular kind of attention whenever the rate outlook shifts. With the fed funds rate at 3.63% (FRED, asof 2026-06-01) and the market pricing a continued easing path, the reflexive question is which financials ETF best captures the move. But the more useful question is narrower: if two of the largest, cheapest sector funds hold nearly the same thing and have returned nearly the same amount, what actually separates them — and does the rate-cut narrative change that answer at all?
This is a comparison of the Financial Select Sector SPDR Fund (XLF) and the Vanguard Financials Index Fund ETF (VFH). Both are broad, cap-weighted, low-cost exposures to US financials. The interesting part is not that one obviously beats the other. It is how little a very different holdings structure has mattered to realized outcomes — and where that could quietly change.
Context: what each fund actually owns
XLF tracks the Financial Select Sector Index — the financials slice of the S&P 500. That means large-cap only: roughly 70-odd holdings, concentrated in money-center banks, diversified financials, insurers, and capital-markets firms. Berkshire Hathaway and JPMorgan typically sit at the top. Importantly, since the 2016 GICS reclassification, real estate is not in XLF — it moved to a separate sector fund.
VFH tracks a broader CRSP US financials benchmark: roughly 400 holdings extending down into mid- and small-cap regional banks, asset managers, and specialty lenders. On paper that is a very different portfolio. In practice, because both indexes are market-cap weighted, the top of each fund is dominated by the same handful of mega-cap names. VFH's long tail of smaller financials carries real weight only in aggregate; individually those positions are fractions of a percent.
That structural detail is the whole story of why these two funds behave so similarly, and it is worth holding onto as we look at the numbers.
The data
| Metric | XLF | VFH |
|---|---|---|
| Full name | Financial Select Sector SPDR | Vanguard Financials Index ETF |
| Expense ratio | 0.08% | 0.09% |
| AUM | $51.4B | $13.8B |
| Inception | 1998-12-16 | 2004-02-04 |
| Distribution yield | 1.5% | 1.8% |
| 5Y CAGR | 11.6% | 11.8% |
| 10Y CAGR | 14.0% | 13.8% |
| 5Y volatility (annualized) | 18.6% | 19.2% |
| Max 5Y drawdown | −25.8% | −25.7% |
| NAV | $56.16 | $137.52 |
Price and return figures are from yfinance, pulled 2026-07-16; expense ratio, AUM, and holdings structure are from the issuer fact sheets (SSGA — XLF; Vanguard — VFH).
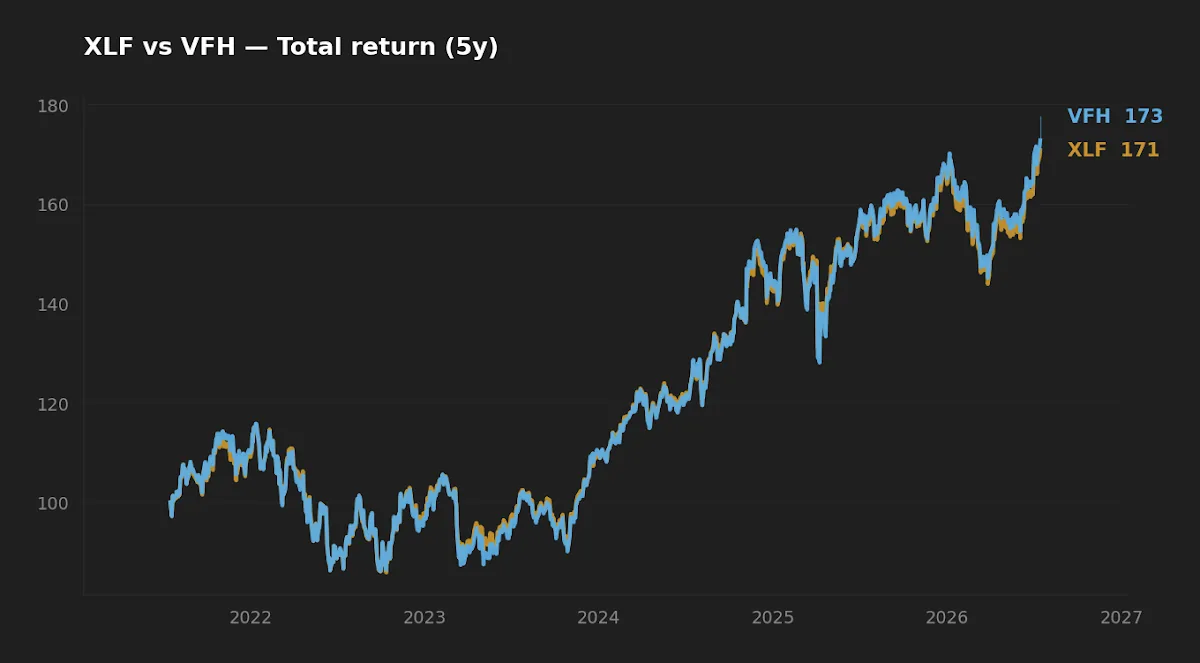
The normalized total-return lines are close to indistinguishable across the window. Over five years VFH edges ahead by about 0.2 percentage points annualized; over ten, XLF edges ahead by roughly the same margin. Those gaps are inside the range of tracking noise, dividend-reinvestment timing, and the small differences in how each index rebalances. Neither is evidence of a durable edge.
Why near-identical returns from very different portfolios
The instinct is that a 400-stock fund should behave measurably differently from a 70-stock fund. The reason it doesn't here is cap weighting. In both indexes, the same mega-cap banks and diversified financials carry the majority of the weight. VFH's additional ~330 names are real companies with real idiosyncratic risk, but their combined weight is modest, and much of their return is itself correlated with the large-cap financials that dominate both funds. The marginal holdings add breadth on a spreadsheet without adding much independent behavior to the portfolio.
This is the non-obvious point worth sitting with: VFH's diversification, relative to XLF, is more nominal than economic. It shows up as a slightly higher realized volatility (19.2% vs 18.6% over five years) — the small-cap tail is more volatile, not less — rather than as a smoother ride. If you were buying VFH specifically for diversification benefit over XLF, the realized data does not support the premium. You are mostly buying the same exposure with a longer, noisier tail.
VFH's diversification relative to XLF is more nominal than economic: five times the holdings, but the same mega-cap banks drive both, and the extra names show up as volatility, not as a smoother ride.
Realized risk and the rate-cut framing
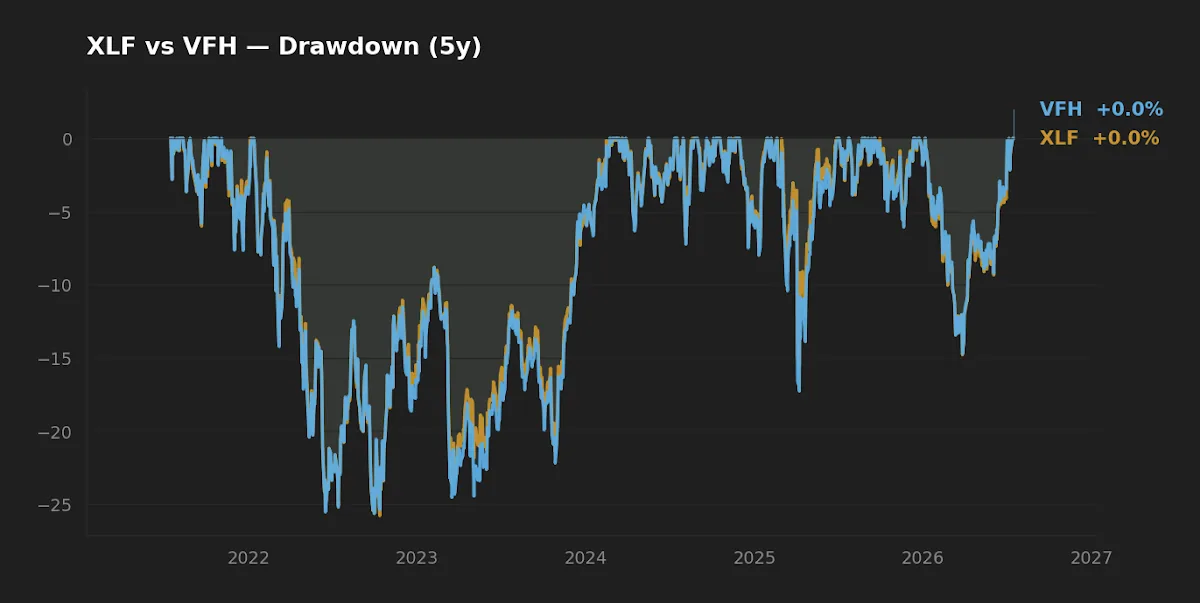
The drawdown profiles reinforce the point. Both funds bottomed near −25.8% and −25.7% within the five-year window, and the shape of their drawdown curves tracks closely. When financials sold off — most sharply during the 2023 regional-bank stress — both funds fell together, because the stress originated in exactly the mid-cap regional banks that VFH holds and XLF largely excludes. In that episode, XLF's narrower, larger-cap composition was marginally more defensive, but the difference was small enough that both delivered essentially the same maximum drawdown over the full window.
This is where the "financials in a rate-cut cycle" headline deserves scrutiny. Financials are not a monolith with respect to rates. Banks can benefit from a steeper yield curve through wider net interest margins, but that depends on the shape of the curve shift, not merely on cuts. Insurers reinvest float at lower yields when rates fall — often a headwind. Asset managers key off equity-market levels more than off the policy rate. With the 10-year Treasury at 4.58% (FRED, asof 2026-07-14) sitting above the fed funds rate, the curve is no longer deeply inverted, and a normalizing curve is generally a more constructive backdrop for bank margins than a rate cut in isolation. The point is that "rate cuts are good for financials" compresses several offsetting mechanisms into one slogan. Neither XLF nor VFH lets you express a view on which mechanism dominates — both give you the blended sector, and the blend is nearly identical.
For readers weighing how much a falling-rate path helps different sleeves of a portfolio, the parallel work on utilities in a rate-cut cycle and on bonds versus cash when yields fall is a useful counterweight: rate sensitivity is specific to what a fund actually owns, not to the sector label on the tin.
Cost, scale, and implementation friction
The headline expense-ratio gap is one basis point — 0.08% for XLF versus 0.09% for VFH. On a decade horizon that is close to a rounding error, and I would not weight it. Where scale matters more is liquidity: XLF's $51.4B in assets and heavy options ecosystem make it one of the most liquid sector ETFs in existence, with tight bid-ask spreads that matter to anyone trading in size or using it tactically. VFH, at $13.8B, is still very liquid by any normal standard, but XLF has the edge for large or frequent transactions.
Initially I assumed the yield difference — 1.8% for VFH versus 1.5% for XLF — reflected a deliberate income tilt. It doesn't; it falls out of composition. VFH's broader, smaller-cap tail includes more higher-payout regional banks and specialty lenders, which lifts the aggregate distribution yield modestly. Neither yield is compelling against the 4.58% 10-year Treasury, and neither fund should be held primarily for income. The distribution split between qualified and ordinary income is broadly similar for both, so the after-tax gap is smaller than the headline yield difference implies.
Winner by category
| Category | Edge | Why |
|---|---|---|
| Cost | XLF (marginal) | 0.08% vs 0.09% — 1 bp, effectively a tie. |
| Realized risk | XLF (marginal) | Slightly lower 5Y volatility (18.6% vs 19.2%); near-identical drawdown. |
| Realized return | Tie | 5Y and 10Y CAGR within ~0.2 pp of each other, opposite directions. |
| Suitability / breadth | VFH | Broader small/mid-cap financials exposure, if that is the intent. |
| Liquidity / tactical use | XLF | Larger AUM, tighter spreads, deep options market. |
FAQ
Is XLF or VFH better for a rate-cut cycle?
Neither is meaningfully better positioned. Both hold the same mega-cap banks that dominate sector returns, and financials' rate sensitivity depends on the curve's shape rather than on cuts alone. The rate narrative is not a strong basis for choosing between them.
Why does VFH hold so many more stocks but perform almost the same as XLF?
Both are cap-weighted, so the largest financials carry most of the weight in each. VFH's ~330 additional smaller names have modest combined weight and returns that are largely correlated with the large caps, so they add volatility more than independent diversification.
Does XLF include real estate?
No. Since the 2016 GICS reclassification, real estate is a separate sector and is excluded from XLF. VFH's benchmark similarly treats financials and real estate as distinct, so neither fund is a REIT vehicle.
Which is cheaper to own?
XLF at 0.08% versus VFH at 0.09% — a one-basis-point difference (issuer fact sheets). For a long-term holder this is negligible. Liquidity and spreads, where XLF has an edge, matter more for anyone trading actively.
Should I hold a financial-sector ETF at all in a diversified portfolio?
A broad-market fund already includes financials at their market weight. A dedicated sector fund is an active overweight bet on one sector. Whether that fits depends on your framework; it is not a default holding. The work on broad-market exposure is a useful baseline before adding any sector tilt.
What this comparison can and can't tell you
The return and risk figures cover a single five- and ten-year window that includes one major sector-specific stress event (2023 regional banks), a rate-hiking cycle, and the early part of an easing cycle. It does not include a 2008-style financial crisis, in which the composition difference between a narrow large-cap fund and a broader fund holding more regional and specialty lenders could matter a great deal more than it did here. Trailing CAGR is also sensitive to endpoints. Treat the near-equivalence as descriptive of this regime, not as a law.
Scenarios where each fund fits
Reader who wants the cleanest, most liquid large-cap financials exposure, possibly for tactical use → XLF, for its scale, spreads, and options depth.
Reader who specifically wants small- and mid-cap financials included and is comfortable with slightly higher volatility → VFH, for its broader reach.
Reader in their 30s, broad-market index core, no sector tilts → likely neither as a standalone position; financials are already held at market weight inside a total-market fund.
Editor's read
If forced to choose one for a deliberate financials overweight, the editor leans slightly toward XLF — not because of the trivial 1 bp fee edge, but because its scale and liquidity are genuine advantages and its realized volatility was marginally lower for essentially the same return. VFH is a perfectly reasonable alternative if the broader small/mid-cap tail is the specific intent, but the realized data suggests you are paying a little extra volatility for diversification that is more nominal than economic. On this pair, the construction question matters more than the rate-cut headline that usually frames it.
The editor holds neither XLF nor VFH at the time of writing; sector exposure is held at market weight through broad-market funds.
Methodology: Price, return, volatility, and drawdown figures from yfinance, pulled 2026-07-16, over trailing 5- and 10-year windows. Expense ratio, AUM, inception, and holdings structure from issuer fact sheets (SSGA for XLF, Vanguard for VFH). Macro figures from FRED (10-year Treasury asof 2026-07-14; fed funds asof 2026-06-01; VIX asof 2026-07-14; CPI YoY asof 2026-06-01).
This article is for educational purposes and does not constitute personalized financial advice. See our full Disclaimer.