Photo by Annie Spratt on Unsplash
The short version
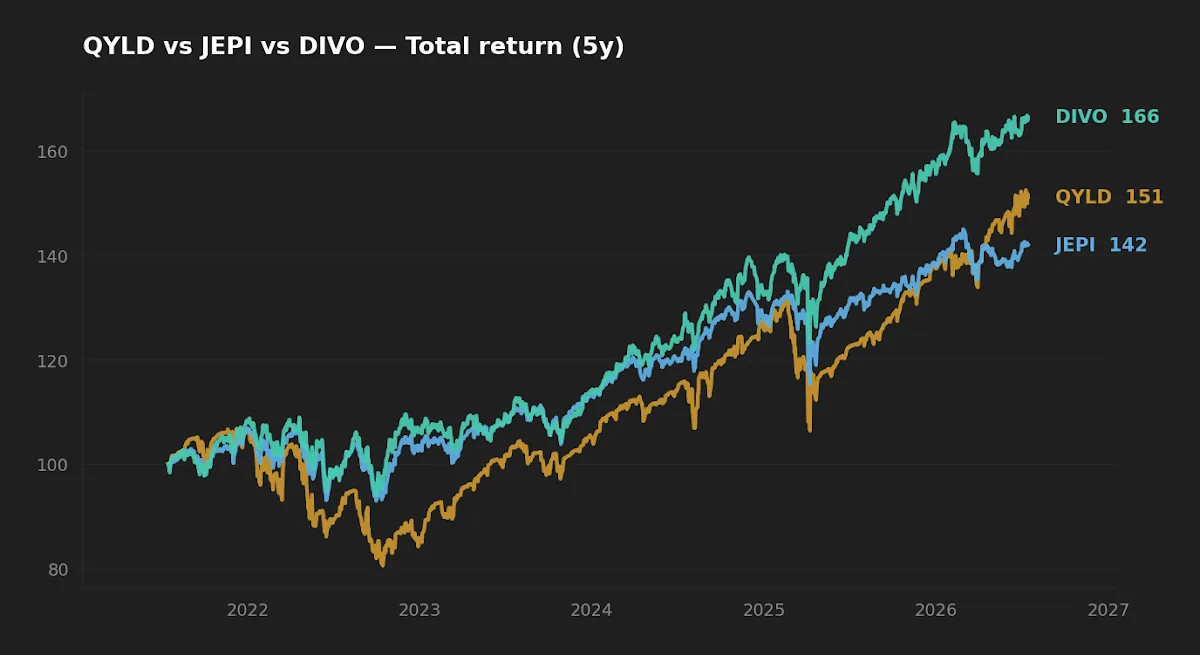
- The three funds sell options in structurally different ways, and over the trailing five years the highest-yielding fund (QYLD, 5.9%) delivered the lowest total return, while the lowest-yielding (DIVO, 2.3%) delivered the highest.
- Distribution yield is not income until you know its tax character — covered-call funds can classify part of what they pay as return of capital, which lowers your cost basis rather than adding to your wealth.
- Bottom line: QYLD trades upside for a fixed premium harvest, JEPI dampens volatility on the S&P 500 with an equity-linked note overlay, and DIVO writes calls selectively on a dividend-growth sleeve — different tools, not interchangeable ones.
A distribution yield of 5.9% looks like an obvious win next to 2.3%. The trailing five-year record says otherwise: the lowest-yielding of these three covered-call funds compounded fastest, and the highest-yielding compounded slowest. That inversion is the whole story of this category, and it turns on two things most yield-focused write-ups skip — what the option overlay does to upside, and what the tax code says the distribution actually is. This is a comparison of mechanics, not a search for the biggest number.
Context: three ways to sell the same premium
All three funds monetize options premium, but the resemblance ends there. QYLD (Global X NASDAQ 100 Covered Call) writes at-the-money calls on the entire Nasdaq-100 and passes through roughly the full premium each month. This caps essentially all upside in exchange for the largest, steadiest premium harvest — a systematic, rules-based buy-write with no discretion.
JEPI (JPMorgan Equity Premium Income) holds a low-volatility, actively selected slice of S&P 500 names and generates most of its distribution through equity-linked notes (ELNs) that embed written calls. The structure smooths the payout and dampens portfolio volatility, but it introduces a layer of counterparty and note-pricing complexity that a plain buy-write does not carry.
DIVO (Amplify CWP Enhanced Dividend Income) starts from a concentrated portfolio of dividend-growth blue chips and writes calls tactically — only on a portion of holdings, only when the manager judges the premium attractive. The base dividend yield is modest; option income is opportunistic rather than maximized. That is why DIVO's stated yield sits lowest while its total return sits highest.
For the mechanics of the S&P-vs-Nasdaq version of this trade, the companion piece on JEPI vs JEPQ is a useful adjacent read, and the SCHD vs JEPI comparison covers whether income-overlay funds belong in a long-term core at all.
The data table
Figures below are total-return and risk statistics computed from yfinance price/distribution history (window ending 2026-07-16); expense ratio, AUM, and structural details are from each issuer's fact sheet. QYLD is the only fund with a full ten-year record — JEPI (2020 inception) and DIVO (2016 inception) do not yet span a decade.
| Metric | QYLD | JEPI | DIVO |
|---|---|---|---|
| Expense ratio | 0.60% | 0.35% | 0.56% |
| AUM | $8.4B | $44.7B | $7.2B |
| Distribution yield (TTM) | 5.9% | 8.1% | 2.3% |
| Inception | 2013-12-11 | 2020-05-20 | 2016-12-13 |
| 5Y CAGR (total return) | 8.5% | 7.4% | 10.8% |
| 10Y CAGR (total return) | 9.9% | n/a | n/a |
| 5Y volatility (annualized) | 14.9% | 11.1% | 11.9% |
| 5Y max drawdown | -24.6% | -13.7% | -13.7% |
| Underlying | Nasdaq-100 | Low-vol S&P 500 + ELNs | Dividend-growth blue chips |
Fact sheets: Global X QYLD, JPMorgan JEPI, Amplify DIVO. One reconciliation note: JEPI's 8.1% trailing yield reflects an unusually rich premium environment earlier in the window; its forward distribution rate moves with volatility and should not be extrapolated. DIVO's 2.3% is the base ordinary-dividend yield and understates its total distribution, because its call income arrives as capital gains rather than dividends.
Why the highest yield produced the lowest return
The chart above is normalized total return — distributions reinvested — so it removes the optical illusion that a high payout creates. DIVO leads, QYLD trails, and the ordering is the mirror image of the yield ranking. The mechanism is not mysterious. QYLD writes at-the-money calls on the full portfolio, so in every month the Nasdaq-100 rallies more than the premium collected, QYLD forfeits the difference. Across a five-year window that included several strong up-legs in large-cap technology, that forfeited upside is exactly the gap you see between QYLD and the others.
DIVO does the opposite by design: it caps only a fraction of the book, keeps most of the equity upside, and lets dividend growth do the compounding. JEPI sits between the two — it sacrifices less upside than QYLD but its low-volatility equity sleeve structurally lags the Nasdaq-100 in a tech-led tape, which is why its 7.4% five-year CAGR is the lowest of the three despite the smoothest ride. The lesson is not "DIVO is better." It is that a covered-call fund's total return is governed by how much upside it surrenders, and yield is the price tag on that surrender, not a measure of what you keep.
Yield is the price tag on surrendered upside, not a measure of what you keep. The fund that gave away the least compounded the most.
The return-of-capital question
Here is the part that yield screens cannot show you. A covered-call fund's distribution is a blend of qualified dividends, ordinary income, short-term capital gains, and — frequently — return of capital (ROC). ROC is not income; it is the fund handing back part of your own principal, which lowers your cost basis and defers, rather than eliminates, the tax. QYLD in particular has historically classified a substantial share of its distributions as ROC in years when option premium exceeded net investment income. That is not inherently bad — ROC can be tax-efficient in a taxable account because it defers the liability until you sell — but it means the headline 5.9% is partly your capital returning to you, not a 5.9% return on it.
This is where the non-obvious asymmetry lives. Two funds can advertise similar yields while distributing them in tax characters that differ by hundreds of basis points after tax. JEPI's ELN income is generally taxed as ordinary income, which is the least favorable treatment and argues strongly for holding it in a tax-advantaged account. DIVO's option income arrives largely as capital gains, and its base payout is qualified dividends — a materially friendlier profile. Comparing these three on distribution yield alone is comparing pre-tax numbers that convert to very different after-tax cash. The yield-versus-total-return discussion in a prior article applies with extra force here: reinvested total return, adjusted for tax character, is the only figure that survives contact with a brokerage statement.
Realized risk: where JEPI and DIVO converge and QYLD does not
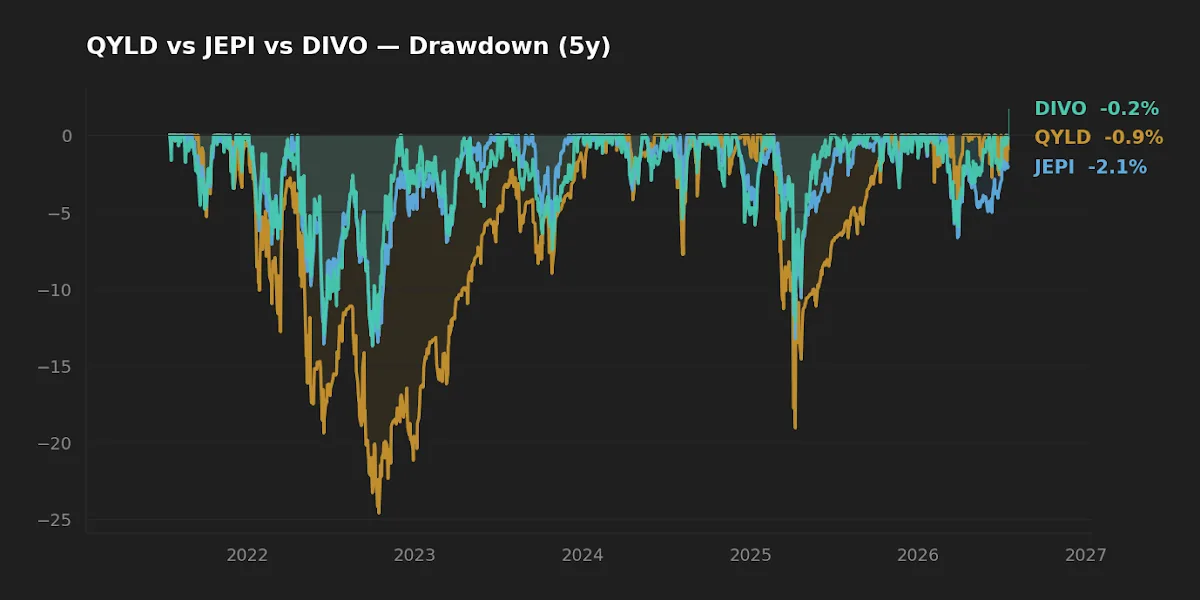
The drawdown chart carries a quieter insight than the return chart. JEPI and DIVO landed on nearly identical worst-case drawdowns (-13.7% for both) and similar volatility (11.1% and 11.9%), despite completely different construction — one a low-vol S&P sleeve with notes, the other a concentrated dividend book with tactical calls. Two different roads arrived at the same realized-risk destination. QYLD, by contrast, drew down -24.6%, nearly double the other two, at 14.9% volatility.
That is the counterintuitive result buried in the numbers: full-portfolio call writing is often sold as a defensive, income-smoothing strategy, yet QYLD carried the most realized risk here. The reason is structural — capping upside does nothing to cap downside. When the Nasdaq-100 falls, QYLD falls with it and keeps only the month's premium as a cushion, so its drawdowns look like a slightly softened version of the underlying index while its recoveries are permanently clipped. A capped-upside, uncapped-downside payoff is not a low-risk profile; it is an asymmetric one. Against a 10-year Treasury now yielding 4.58% (FRED, asof 2026-07-14) and a benign VIX near 16.5 (FRED, asof 2026-07-14), an investor reaching for QYLD's 5.9% is accepting equity-scale drawdowns for a spread over the risk-free rate that a low-volatility equity fund captured with far less pain.
Scoreboard: winner by category
| Category | Winner | Why |
|---|---|---|
| Cost | JEPI (0.35%) | 25 bp cheaper than QYLD, 21 bp cheaper than DIVO; scale helps. |
| Realized risk | JEPI / DIVO (tie) | Both -13.7% max drawdown vs QYLD's -24.6%. |
| Realized return (5Y) | DIVO (10.8%) | Kept the most upside via selective call writing. |
| Headline yield | JEPI (8.1%) | Highest distribution — but ordinary-income taxed. |
| Tax character | DIVO | Qualified dividends + capital-gain option income. |
What this comparison can and can't tell you
The five-year window is a single regime: a low-rate-to-rising-rate transition dominated by a large-cap technology bull market. That environment is close to a worst case for QYLD (maximum forfeited upside) and close to a best case for a dividend-growth book like DIVO's. In a flat or choppy, range-bound market, the ranking could invert — QYLD's premium harvest is designed precisely for sideways tapes where there is little upside to give away. None of these funds has been tested by a prolonged high-volatility bear market in its current form; QYLD's ten-year record is the only decade-long data point and it still omits a 2008-style event. Treat the numbers as evidence about one regime, not a forecast across cycles.
Scenarios where each fund fits
- Reader in their 30s, 401(k)-only, decades from drawdown: none of these is an obvious core holding — the capped upside works against a long compounding horizon. If income is wanted at all, DIVO's upside retention is the least costly choice, but a total-market or dividend-growth fund may serve better. See the three-fund portfolio discussion.
- Retiree drawing a paycheck from the portfolio in a taxable account: tax character dominates. DIVO's qualified/capital-gain profile is friendliest; JEPI's ordinary-income distributions belong in an IRA if held at all.
- Investor who expects a flat, range-bound market and wants maximum current premium: QYLD's mechanics are purpose-built for that regime — with eyes open to equity-scale drawdowns and the return-of-capital character of the payout.
Editor's read
If forced to hold one of the three as a small income satellite, the editor leans toward DIVO: it surrendered the least upside, matched JEPI on realized drawdown, and distributes in the most tax-efficient character — the three things that actually survive to the after-tax total-return line. QYLD's headline yield is the least informative number in this comparison; a capped-upside, uncapped-downside payoff earning a modest spread over a 4.58% Treasury is a hard trade to justify for a long horizon. But none of the three is a core holding in the editor's framework — they are tactical tools for specific regimes, and the discipline is to size them accordingly, not to be recruited by a distribution rate.
The editor does not hold QYLD, JEPI, or DIVO at the time of writing.
FAQ
Is QYLD's 5.9% yield "real" income? Partly. A meaningful share of covered-call fund distributions can be classified as return of capital, which reduces your cost basis rather than adding to wealth. Check the fund's year-end 19a-1 notices and 1099 for the actual breakdown before treating the full yield as income.
Why did DIVO return more than QYLD despite a much lower yield? DIVO writes calls on only part of its portfolio, so it keeps most of the equity upside. QYLD writes at-the-money calls on the whole book and forfeits upside above the strike every month. Over a rising market, that forfeited upside is the entire performance gap.
Which of the three is most tax-efficient? On the data here, DIVO — its base payout is qualified dividends and its option income is treated as capital gains. JEPI's equity-linked-note income is generally taxed as ordinary income, so it is best held in a tax-advantaged account.
Are these low-risk because they sell options? Not necessarily. Writing calls caps upside but does not cap downside. QYLD's -24.6% five-year max drawdown was nearly double JEPI's and DIVO's, so full-portfolio call writing carried the most realized risk in this window.
Do any of these belong in a long-term core portfolio? That depends on your framework, not on the yield. Their capped upside works against multi-decade compounding, which is why the editor treats them as regime-specific satellites rather than core holdings. The discussion on strategic cash and risk management is a useful companion.
Key takeaways
- Over the trailing five years the yield ranking (QYLD > JEPI > DIVO) was the inverse of the total-return ranking (DIVO 10.8% > QYLD 8.5% > JEPI 7.4%).
- Distribution yield says nothing about tax character — return of capital, ordinary income, and qualified dividends convert to very different after-tax cash.
- Capping upside does not cap downside: QYLD's -24.6% max drawdown was the largest despite the highest yield, while JEPI and DIVO converged at -13.7%.
- The five-year record reflects one tech-led regime; a flat or bearish market could reorder these funds, and none has been stress-tested by a prolonged high-volatility bear in its current form.
- Match the tool to the regime and the account: DIVO for upside retention and tax character, JEPI for volatility dampening in a tax-advantaged account, QYLD for premium harvest in a range-bound market.
Methodology: Total-return CAGR, volatility, and max-drawdown figures computed from yfinance price and distribution history for the window ending 2026-07-16 (data pulled 2026-07-16). Expense ratio, AUM, distribution yield, and structural details from each issuer's fact sheet (Global X, JPMorgan Asset Management, Amplify ETFs). Macro figures from FRED (10-year Treasury and VIX asof 2026-07-14; fed funds and CPI asof 2026-06-01).
This article is for educational purposes and does not constitute personalized financial advice. See the full Disclaimer.