
The short version
- JEPI and JEPQ charge the identical 0.35% expense ratio and run the same machinery — a defensive equity sleeve plus an options-overlay via equity-linked notes — but on different underlyings: the S&P 500 versus the Nasdaq-100.
- JEPQ's higher distribution yield (10.1% vs 8.5%) is not free money; it is option premium harvested from a more volatile index, and it comes with sharper upside truncation and a mostly ordinary-income tax profile.
- Bottom line: JEPI is the steadier income sleeve with a longer track record; JEPQ is the higher-octane variant whose live history is too short to judge across a full cycle.
The central question with these two funds is not "which yields more" — JEPQ plainly does — but whether the extra yield is compensation for risk you actually want to hold. Both are JPMorgan equity-premium-income ETFs that pair a low-volatility equity portfolio with a written-call overlay. They differ in one variable: the index underneath. That single difference cascades into yield, drawdown behavior, tax treatment, and how much of a tech rally you get to keep.
Context: what "equity premium income" actually buys
Both funds do two things at once. They hold a equity portfolio designed to track most of an index's return with less volatility, and they sell call exposure — in JPMorgan's case through equity-linked notes (ELNs) — to convert a slice of expected upside into cash distributions. The premium collected from selling that optionality is what funds the monthly payout. Higher implied volatility on the underlying means richer premium, which is the entire reason JEPQ (Nasdaq-100) distributes more than JEPI (S&P 500).
The trade is structural, not magical. You are short volatility and short a piece of the right tail. In flat or choppy markets, the overlay earns its keep. In a strong, sustained rally — exactly the regime the Nasdaq-100 is prone to — the written calls cap participation and you lag the index you are built on. This is the asymmetry the headline yield hides, and it matters more for JEPQ than for JEPI because the Nasdaq-100's upside dispersion is wider.
The data
| Metric | JEPI | JEPQ |
|---|---|---|
| Name | JPMorgan Equity Premium Income | JPMorgan Nasdaq Equity Premium Income |
| Underlying | S&P 500 (low-vol sleeve) | Nasdaq-100 (low-vol sleeve) |
| Expense ratio | 0.35% | 0.35% |
| AUM | $44.6B | $39.6B |
| Distribution yield | 8.5% | 10.1% |
| Inception | 2020-05-20 | 2022-05-03 |
| NAV | $55.51 | $58.86 |
| 5Y CAGR | 7.3% | n/a (insufficient history) |
| 5Y volatility | 11.0% | n/a |
| 5Y max drawdown | −13.7% | n/a |
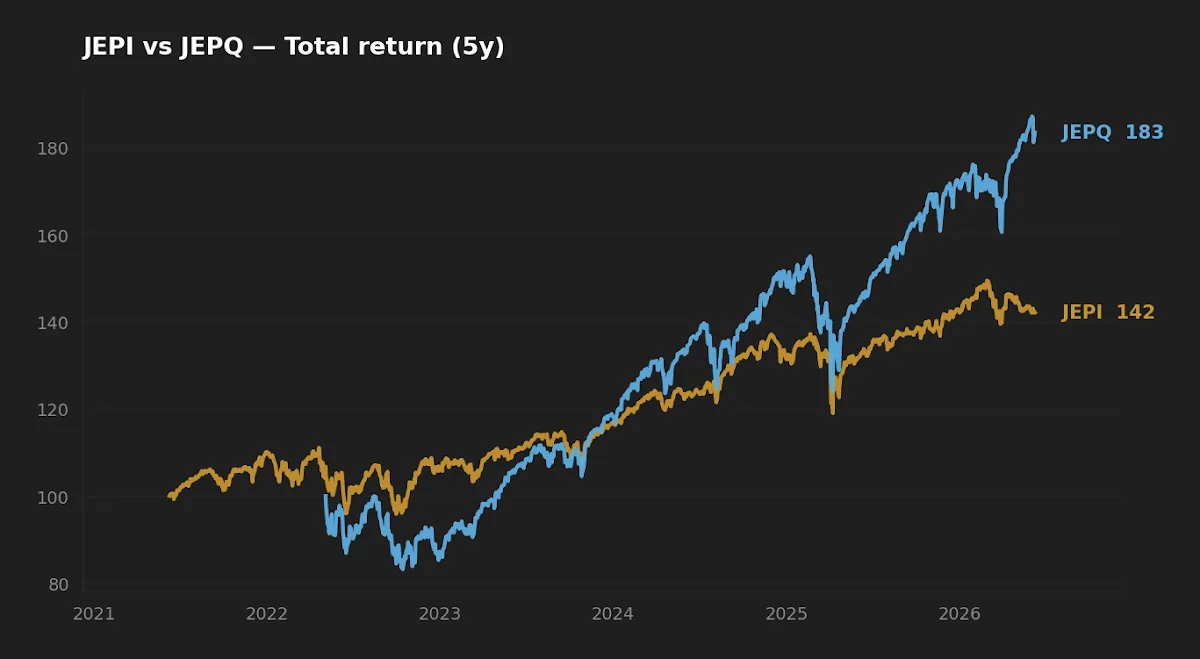
Price and return figures via yfinance, pulled 2026-06-08. Expense ratio, AUM, yield, and inception confirmed against JPMorgan Asset Management product pages (am.jpmorgan.com). Note the missing JEPQ rows: the fund launched 2022-05-03, so a clean five-year window does not yet exist. That gap is not a rounding issue — it is the single most important limitation in this comparison, and I will not paper over it with a backfilled proxy.
Yield is a transfer, not a return
JEPQ's 10.1% distribution against JEPI's 8.5% looks like a clear win until you trace where the cash comes from. The premium is harvested from the Nasdaq-100's higher implied volatility. You are being paid more because you are selling more valuable optionality — and giving up more of the index's best months to do it. Against a backdrop where the federal funds rate sits at 3.63% (FRED, asof 2026-05-01) and CPI is running 3.9% year over year (FRED, asof 2026-04-01), both yields clear cash and inflation comfortably on a nominal basis. But a high distribution paired with a flat-to-declining NAV is income financed partly by your own principal. The metric that matters is total return, and total return depends on whether the overlay's premium offsets the capped upside over a full cycle.
Initially I treated the 160 bp yield gap as JEPQ's decisive edge. Then I separated distribution yield from total return and the case softened: on the Nasdaq-100, the months you most want to participate in are precisely the months the written calls truncate. The richer premium is partly compensation for surrendering a fatter right tail — not a free upgrade.
The extra yield on JEPQ is option premium extracted from a more volatile index — you are paid more because you surrender more of the upside, not because the fund is more efficient.
Realized risk: one fund has a track record, the other has a promise
JEPI has lived through enough to show its hand: a 5-year CAGR of 7.3%, realized volatility of 11.0%, and a max drawdown of −13.7%. That drawdown is the headline feature — roughly half to two-thirds of what the underlying S&P 500 endured over comparable stress, which is exactly what a low-volatility equity sleeve plus an income overlay is supposed to deliver. The fund trades return ceiling for a shallower hole.
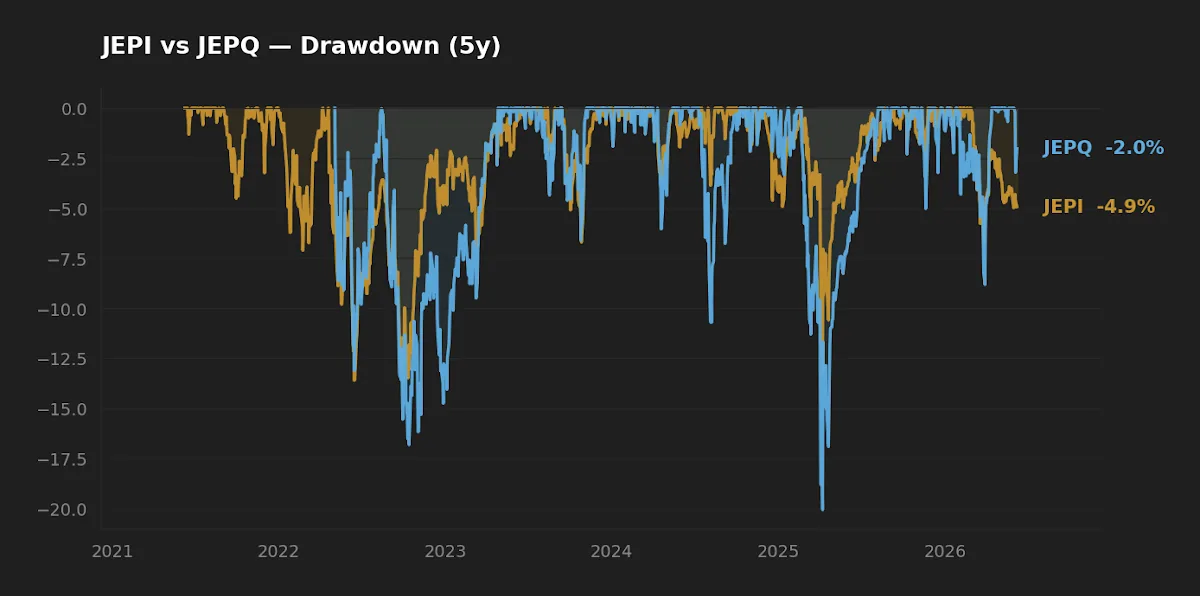
JEPQ has no comparable five-year record because it has not existed for five years. What we can say structurally: the Nasdaq-100 carries higher beta and wider dispersion than the S&P 500, so JEPQ's low-vol-plus-overlay construction starts from a more volatile base. Even with the dampening, its realized drawdowns should run deeper than JEPI's in a tech-led selloff, and its recoveries should be more clipped on the way back up because the calls cap the rebound. The honest position is that JEPQ's risk profile is a reasoned extrapolation, not a measured one. Anyone presenting a five-year JEPQ drawdown number is splicing in proxy data. For a longer view on how a 20% Nasdaq-100 correction has historically resolved for patient holders, the editor's earlier 10+ year Nasdaq-100 correction analysis is the relevant companion.
The tax angle most yield comparisons skip
Because the overlay income flows through ELNs rather than qualified dividends, a large share of both funds' distributions is taxed as ordinary income rather than at the qualified-dividend rate. For a taxable account, that pushes the relevant comparison from headline yield to after-tax yield, and it widens the gap between the two funds' usefulness depending on your bracket. In a tax-advantaged account the distinction disappears; in a taxable account at a high marginal rate, JEPQ's nominal yield advantage shrinks meaningfully once the ordinary-income haircut is applied. The tax-cost ratio is where a 10.1% sticker can quietly become an 8-point-something experience. This is the kind of implementation friction that does not show up on a fact sheet but compounds over decades.
Scoreboard
| Category | Edge | Why |
|---|---|---|
| Cost | Tie | Both 0.35%; no fee gap to compound. |
| Realized risk | JEPI | Documented −13.7% max drawdown and 11.0% vol; JEPQ lacks a full-cycle record. |
| Distribution yield | JEPQ | 10.1% vs 8.5%, funded by richer Nasdaq-100 option premium. |
| Suitability (core income) | JEPI | Longer track record, broader underlying, shallower drawdowns. |
Scenarios where each fund fits
Reader in their 50s, taxable brokerage, wants a defensive income sleeve → JEPI's broader underlying and documented drawdown behavior make it the more legible choice, and its distribution profile is slightly easier on after-tax yield.
Reader already heavy in broad-market and AI-infrastructure equity, wants a higher-yield satellite in a tax-advantaged account → JEPQ can serve as a small tilt, where the ordinary-income tax drag is neutralized and the higher premium is the point. Sizing matters; this is a satellite, not a core.
Reader who wants total return over a multi-decade horizon and does not need the cash → Neither fund is built for you. The overlay caps the compounding you would otherwise capture; a plain index sleeve is the more direct tool. For how an income sleeve sits inside a fuller allocation, see the editor's 90/10 allocation framework.
What this comparison can and can't tell you
It can tell you the funds' costs, current yields, and JEPI's realized five-year risk and return. It cannot give you a like-for-like five-year JEPQ track record, because the fund is only about four years old — the single largest blind spot here. It cannot tell you how either overlay behaves in a regime we have not yet observed (a prolonged high-volatility grind, or a melt-up that pins the written calls in the money for quarters at a time). Single-regime risk is real: most of both funds' lives have unfolded in a specific rate and volatility environment, and live-vs-backtest gaps are widest exactly for option-overlay strategies. Treat the JEPQ commentary as structural reasoning, not measured fact.
Frequently asked questions
Is JEPQ just JEPI on the Nasdaq-100? Mechanically, close — same issuer, same 0.35% fee, same low-vol-equity-plus-ELN-overlay design. The underlying index is the difference, and it drives the higher yield and (structurally) deeper risk.
Why does JEPQ yield more if the fee is the same? The Nasdaq-100 has higher implied volatility, so the written-call premium is richer. The extra distribution is harvested optionality, not a more efficient fund.
Are the distributions qualified dividends? A significant portion flows through equity-linked notes and is taxed as ordinary income. In a taxable account, compare after-tax yield, not headline yield.
Will these funds keep up with the index in a strong rally? Generally no. The written calls cap upside, so in sustained rallies both funds lag their underlying — and JEPQ lags more because the Nasdaq-100's right tail is fatter.
Can I use one as a core holding? They are designed as income sleeves, not total-return cores. JEPI is the more defensible core-income candidate given its track record; JEPQ is better sized as a satellite. For a related income-overlay contrast, see JEPI vs AIPI.
Key takeaways
- Same issuer, same 0.35% fee, same overlay mechanics — the only real variable is the index underneath, and it explains everything that follows.
- JEPQ's 10.1% yield is richer because the Nasdaq-100 is more volatile; you are paid more for surrendering more upside, not for owning a better fund.
- JEPI has a documented five-year record (7.3% CAGR, 11.0% vol, −13.7% drawdown); JEPQ's risk profile is reasoned extrapolation, not measured fact.
- In taxable accounts, the ordinary-income tax treatment of ELN distributions narrows JEPQ's yield advantage — compare after-tax.
- Both are income sleeves, not compounding cores; if total return is the goal, a plain index sleeve is the more direct instrument.
Editor's read
If forced to hold one as a long-term income sleeve, the editor leans toward JEPI — not because JEPQ is poorly built, but because JEPI has lived through enough to be judged on evidence rather than structure, and its broader underlying produces shallower, more recoverable drawdowns. JEPQ is the more interesting satellite for a tax-advantaged account already diversified elsewhere, where its higher premium can do its work without the ordinary-income drag. The decisive factor is not the yield gap; it is that one fund has a track record across stress and the other still has a promise.
The editor does not hold either fund at the time of writing.
Methodology: price, NAV, CAGR, volatility, and drawdown via yfinance, pulled 2026-06-08; expense ratio, AUM, distribution yield, and inception cross-checked against JPMorgan Asset Management product pages. Macro figures from FRED (federal funds rate asof 2026-05-01; CPI year-over-year asof 2026-04-01). Window analyzed: fund inception through 2026-06-08, with JEPQ limited by its 2022 launch.
This article is for educational purposes and does not constitute personalized financial advice. See the full Disclaimer.