Photo by Annie Spratt on Unsplash
The short version
- These three funds share a "China" label but are not three flavors of the same trade: KWEB is an internet-sector fund, FXI is a state-heavy large-cap fund, and MCHI is the closest thing to broad China beta.
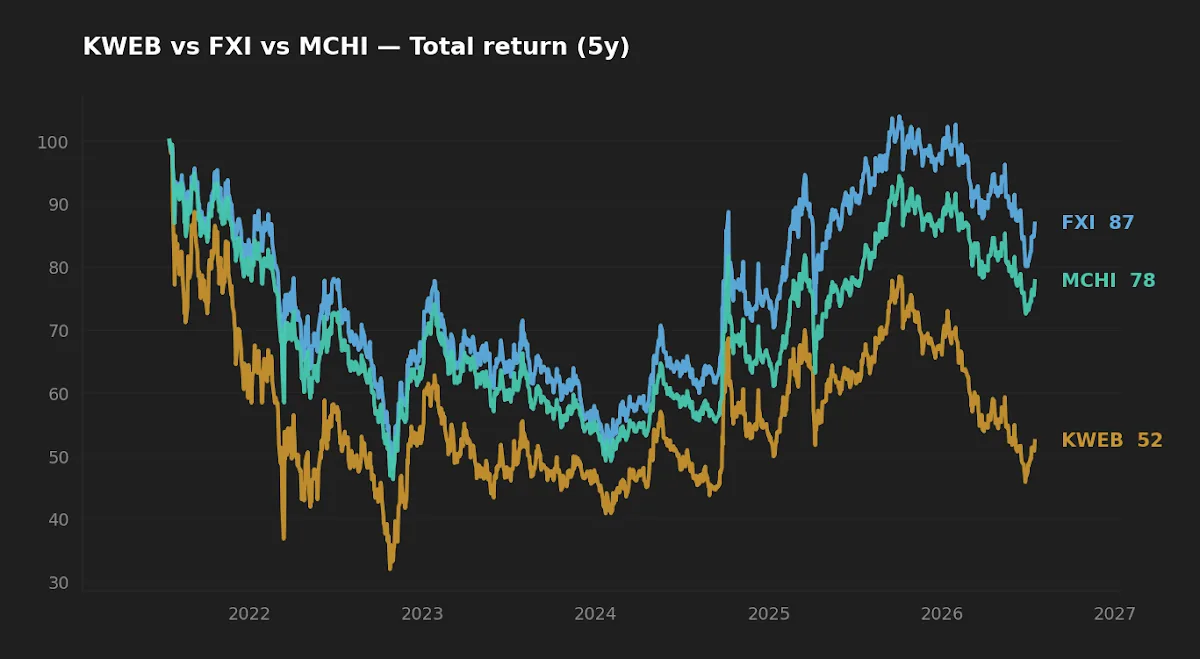
- Over the trailing five years all three lost ground, but the dispersion is large — KWEB compounded at roughly −11.6% a year with a −69.0% peak-to-trough drawdown, while MCHI's broader basket held its ten-year record best at +4.5% annualized.
- Bottom line: FXI and MCHI look similar on the tin but MCHI overlaps far more with KWEB than with FXI, which changes what "diversifying across two China ETFs" actually buys you.
Owning China through a single ETF ticker feels like one decision. It is really two: which slice of the market you want, and which wrapper delivers it. KWEB, FXI, and MCHI are the three most common answers, and the gap between them is wider than the shared country label suggests. The central question of this piece is not "is China cheap?" but "when these three funds all say China, what are you actually holding — and how differently have they behaved when the market broke?"
That matters because the naive version of diversification — buy two China ETFs so no single one dominates — can quietly leave you doubled up on the same handful of internet names while believing you have spread the risk.
The 90-second orientation
All three funds give a US-based investor exposure to Chinese equities without opening a foreign brokerage account, and all three trade in dollars. The differences sit in the index each one tracks.
KWEB (KraneShares CSI China Internet ETF) holds Chinese internet and platform companies — the software, e-commerce, and online-services layer. It is a sector fund that happens to be defined by a country. FXI (iShares China Large-Cap ETF) tracks the 50 largest Chinese companies available through Hong Kong-listed H-shares, a basket historically tilted toward state-owned banks, insurers, and energy. MCHI (iShares MSCI China ETF) is the broadest of the three, spanning hundreds of names across sectors and share classes, which makes it the nearest proxy for "the Chinese equity market" as a whole.
The consequence is that FXI and MCHI both carry the "large-cap" framing, but MCHI's market-cap weighting pushes it toward the same large internet platforms that dominate KWEB. So the two funds that sound most alike on paper — FXI and MCHI — are in practice the least correlated in composition, and the two that sound most different — KWEB and MCHI — share a large overlap at the top of the book. That inversion is the single most useful thing to understand before comparing returns.
The data
| Metric | KWEB | FXI | MCHI |
|---|---|---|---|
| Fund | KraneShares CSI China Internet | iShares China Large-Cap | iShares MSCI China |
| Expense ratio | 0.70% | 0.73% | 0.59% |
| AUM | $4.9B | $4.5B | $5.9B |
| Inception | 2013-07-31 | 2004-10-05 | 2011-03-29 |
| Distribution yield | 8.6% | 2.1% | 2.1% |
| 5Y CAGR | −11.6% | −2.1% | −4.4% |
| 10Y CAGR | +0.4% | +2.6% | +4.5% |
| 5Y volatility (annualized) | 47.6% | 31.6% | 30.7% |
| 5Y max drawdown | −69.0% | −52.4% | −54.3% |
Price, return, volatility, and drawdown figures are computed from yfinance adjusted-close data pulled 2026-07-16, windows as labeled. Expense ratio, AUM, and inception are from issuer fact sheets: KWEB, FXI, and MCHI. One number deserves a caveat before you anchor on it: KWEB's 8.6% trailing distribution yield is not a durable income stream from dividend-paying holdings — internet growth companies pay little — but largely an artifact of return-of-capital and irregular distributions on a fund whose NAV has fallen sharply. Read it as a mechanical byproduct of the price decline, not as yield you can spend.
Cost is the smallest difference here
MCHI is the cheapest at 0.59%, undercutting FXI's 0.73% by 14 basis points and KWEB's 0.70% by 11. In most head-to-head ETF comparisons I write, the fee gap is where the argument ends, because cost is the one input you control and it compounds relentlessly. Here it is real but secondary. When realized annual returns range across roughly nine and a half percentage points between the best and worst of these three, a 0.14% expense difference is rounding error against the composition bet. That does not make cost irrelevant — over decades 14 basis points still matters, and it tilts the tie-breaker toward MCHI when two funds are otherwise close. It means the primary decision is what you hold, and only then what it costs to hold it.
The two funds that sound most alike — FXI and MCHI — are the least alike in what they own; the two that sound most different share the crowded top of the book.
Realized risk: the drawdowns were not equal
The five-year window covers the exact stress test that matters for this asset class — the 2021–2022 regulatory crackdown on Chinese platform companies and the property-sector deleveraging that followed. That is a single regime, and a punishing one, so read these drawdowns as "how did each structure behave in the worst China-specific shock of the decade," not as a general law.
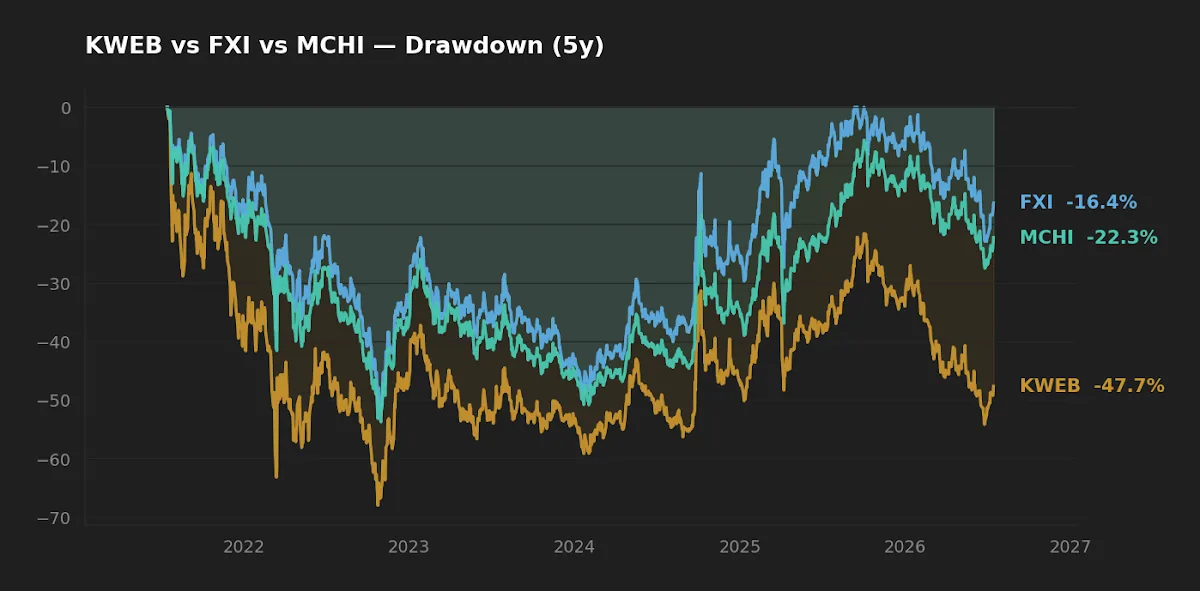
KWEB fell 69.0% peak to trough with 47.6% annualized volatility — the signature of a concentrated sector fund hit directly by the regulation that targeted its holdings. FXI and MCHI, more diversified across sectors, drew down 52.4% and 54.3% respectively at roughly two-thirds of KWEB's volatility. The interesting detail is that MCHI drew down slightly more than FXI despite being the broader fund. That is the internet overlap showing up in the risk statistics: MCHI's market-cap weighting loads it onto the same platform names that drove KWEB's collapse, so its "broad" basket was less insulated than FXI's state-heavy one during precisely this episode. Breadth diversified MCHI against most risks, but not against the one that actually arrived.
Return: the ten-year record separates from the five-year
Over five years all three are negative, which tells you the entry regime dominated. The ten-year figures are more informative about structure. MCHI compounded at +4.5% annually over the decade, FXI at +2.6%, and KWEB at +0.4% — essentially flat across ten years, having given back a spectacular 2020 run in the crackdown. The ordering is worth sitting with: the broadest fund led, the sector fund trailed, and the state-heavy large-cap fund sat between them. None of these is a return you would have accepted knowingly against a US index over the same period, and that is the honest headline. The comparison here is relative, not an argument that any of the three earned its keep.
It is also worth framing against today's alternatives. With the US 10-year Treasury near 4.58% (FRED, asof 2026-07-14) and inflation running around 3.7% year over year (FRED, asof 2026-06-01), the opportunity cost of a decade of low-single-digit or negative equity returns is not abstract. A risk-free rate above 4% raises the bar every volatile equity sleeve has to clear.
Where each fund fits
KWEB is the pure expression of a view — if your thesis is specifically that Chinese internet platforms are mispriced, KWEB delivers that with no dilution, and the 47.6% volatility is the price of the precision. FXI is the least internet-exposed of the three, which makes it the odd tool for an investor who wants China's old-economy and financial base without doubling up on platforms — useful precisely because it is not what MCHI holds. MCHI is the default "own the market" choice and the cheapest, but a buyer should know they are already substantially exposed to the KWEB names inside it.
The practical takeaway on diversification: pairing KWEB with MCHI is closer to concentration than to spreading risk, because the overlap is large. If the goal is genuinely to diversify a single China allocation across two structures, FXI plus KWEB captures more distinct exposure than MCHI plus KWEB — an asymmetry the shared "large-cap" labels actively hide. Readers weighing single-country bets against a broad-international core may find the three-fund portfolio review a useful counterweight, and those thinking about concentration mechanics more generally can see a cleaner example in the SMH vs SOXX comparison.
Scoreboard: winner by category
| Category | Edge | Why |
|---|---|---|
| Cost | MCHI | 0.59% vs 0.70% / 0.73% |
| Realized risk (5Y) | FXI | Shallowest drawdown (−52.4%), lower internet concentration |
| Realized return (10Y) | MCHI | +4.5% CAGR, best of the three |
| Suitability as broad China beta | MCHI | Widest basket, cheapest, most representative |
| Suitability as a specific view | KWEB | Undiluted internet-sector expression |
Frequently asked questions
Is MCHI just a cheaper version of FXI? No — that is the most common misread. FXI holds 50 Hong Kong-listed large-caps skewed toward state-owned financials and energy; MCHI holds a far broader, market-cap-weighted basket that tilts toward large internet platforms. They differ in composition, not just fee.
Why is KWEB's yield so high? The 8.6% trailing distribution yield reflects return-of-capital and irregular distributions against a NAV that has fallen sharply, not durable dividend income from the underlying growth companies. Treat it as a mechanical artifact, not spendable yield.
Which had the worst drawdown? KWEB, at −69.0% over the trailing five years, driven by its concentration in the internet-platform names that were the direct target of the 2021–2022 regulatory tightening.
If I want to diversify my China exposure across two funds, which pair? FXI plus KWEB gives more distinct exposure than MCHI plus KWEB, because MCHI already overlaps heavily with KWEB at the top of its holdings. Pairing MCHI and KWEB concentrates rather than diversifies.
Do these numbers mean China ETFs are a buy or a sell? Neither — this is a structural comparison of three wrappers, not a market call. All three carry single-country and single-regime risk, and the five-year window reflects one severe episode that may or may not characterize the future.
Editor's read
If the task is to hold broad Chinese equity in one line, the editor leans MCHI: it is the cheapest at 0.59%, the most representative of the market, and posted the best ten-year record. But the more important conclusion is structural — an investor pairing two of these for "diversification" should pair FXI with KWEB, not MCHI with KWEB, because MCHI and KWEB share the internet names that dominated both the 2020 run-up and the subsequent collapse. The label similarity between FXI and MCHI is misleading; the composition is what to trade on.
Holdings disclosure: the editor does not hold KWEB, FXI, or MCHI at the time of writing.
What this comparison can and can't tell you
The five-year window is a single, unusually specific regime — a China-targeted regulatory shock plus a property-sector unwind. That makes the drawdown figures a real stress test but a narrow one; they say little about how these funds behave in a broad global risk-off event unrelated to Chinese policy. Ten years captures more, but still one country's path. None of this incorporates currency hedging, tax treatment of foreign distributions, or the delisting and variable-interest-entity structural risks specific to US-listed Chinese equities, all of which are material and none of which show up in a CAGR number. Read the figures as description, not forecast.
Key takeaways
- KWEB, FXI, and MCHI are a sector fund, a state-heavy large-cap fund, and a broad-market fund respectively — not three versions of one bet.
- MCHI overlaps more with KWEB than with FXI, which inverts the naive diversification intuition.
- KWEB carried the deepest realized risk (−69.0% drawdown, 47.6% volatility); FXI was the shallowest despite being narrower than MCHI.
- MCHI led on ten-year return (+4.5%) and cost (0.59%), making it the default broad-exposure choice.
- Against a 4.58% risk-free rate, a decade of low-single-digit or negative returns sets a high bar these funds have not cleared in absolute terms.
Methodology: return, volatility, and drawdown computed from yfinance adjusted-close data pulled 2026-07-16; five-year and ten-year windows as labeled. Expense ratio, AUM, and inception from issuer fact sheets (KraneShares and iShares), same date. Macro figures from FRED as of the dates cited. This article is for educational purposes and does not constitute personalized financial advice. See our Disclaimer.