
Photo by Zlaťáky.cz on Unsplash
The short version
- All three hold futures, not physical barrels or bushels — so the return you receive is spot price movement plus (or minus) roll yield, and the roll term is where these funds quietly diverge.
- DBC and PDBC track the same optimum-yield methodology built to soften contango; GSG tracks the front-month S&P GSCI, which carries a much heavier energy weight and shows it in higher volatility (22.8% vs ~19.2%) and a deeper five-year drawdown (-29.1%).
- Bottom line: PDBC's No K-1 structure and lower 0.59% fee make it the cleaner default for a taxable long-horizon sleeve; GSG is a concentrated energy-heavy expression, not a diversified one.
A broad commodity ETF is one of the few products where the label on the tin tells you almost nothing about what you own. Two funds can both call themselves "diversified commodity" and behave like different asset classes — because the index weights differ, and because the return comes not from holding a commodity but from continuously rolling futures contracts forward. The question worth answering is not "which commodity fund is best," but what each of DBC, PDBC, and GSG actually holds, and why the roll — the least visible part of the return — often matters more than the headline spot move.
Context: you are buying futures, not barrels
None of these three funds stores physical oil, copper, or wheat. They hold futures contracts, which expire. To maintain exposure, the fund sells the expiring contract and buys a later-dated one. When later-dated contracts cost more than near-dated ones — contango — that roll locks in a small loss each cycle. When they cost less — backwardation — the roll adds return. Over a decade this roll yield can swamp the spot price change entirely. A fund can be right about oil going up and still lose money if the curve punishes every roll.
That mechanic is why index construction is the whole game here. The Invesco DB pair (DBC and PDBC) uses an "optimum yield" rule that selects the contract along the curve expected to minimize contango drag rather than blindly buying the front month. GSG, tracking the S&P GSCI, rolls the front month on a fixed schedule and weights components by world production — which tilts it heavily toward energy. Those are structurally different bets wearing similar names.
The data
| Metric | DBC | PDBC | GSG |
|---|---|---|---|
| Name | Invesco DB Commodity Index Tracking | Invesco Optimum Yield Diversified Commodity (No K-1) | iShares S&P GSCI Commodity-Indexed Trust |
| Expense ratio | 0.85% | 0.59% | 0.75% |
| AUM | $1.6B | $5.3B | $0.8B |
| Inception | 2006-02-03 | 2014-11-07 | 2006-07-10 |
| Distribution yield | 2.8% | 3.2% | 0.0% |
| 5Y CAGR | 11.9% | 11.4% | 14.6% |
| 10Y CAGR | 8.4% | 8.1% | 7.4% |
| 5Y volatility | 19.3% | 19.2% | 22.8% |
| 5Y max drawdown | -27.3% | -27.6% | -29.1% |
| Tax form | K-1 | 1099 (No K-1) | K-1 |
Return, volatility, and drawdown figures are from yfinance price history, pulled 2026-07-16; expense ratios, AUM, distribution yields, and structural details are from the Invesco DBC and PDBC fact sheets and the iShares GSG fund page. Yields on commodity strategy funds are largely a function of the collateral — the T-bills the fund holds against its futures — so in a 4.58% ten-year, 3.63% fed-funds environment (FRED, asof 2026-07-14 and 2026-06-01), those distributions are mostly interest income, not a commodity signal.
Why GSG's higher return is not a free lunch
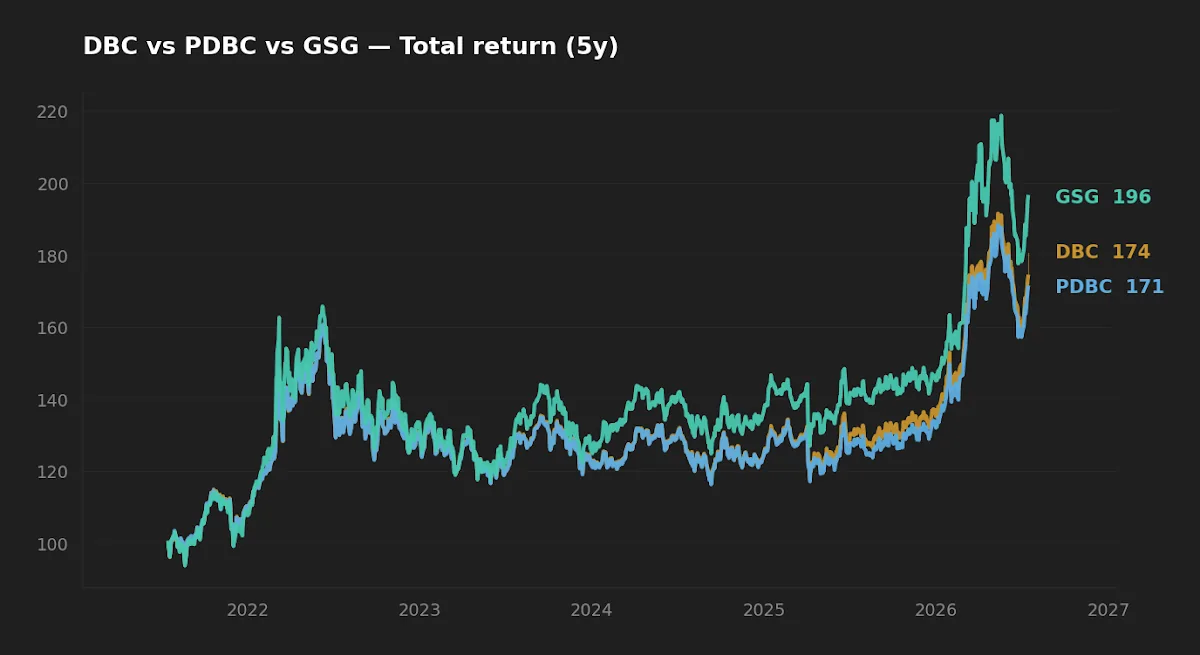
GSG posted the best five-year CAGR of the three at 14.6%, versus 11.9% for DBC and 11.4% for PDBC. The instinct is to read that as GSG "winning." The honest reading is narrower: GSG is the most energy-concentrated of the three, and the last five years contained a powerful energy regime — the 2021–2022 supply shock and its aftermath. The S&P GSCI's production-weighting scheme routinely places a majority of the basket in energy, so GSG is closer to a levered bet on crude and refined products than a diversified commodity holding.
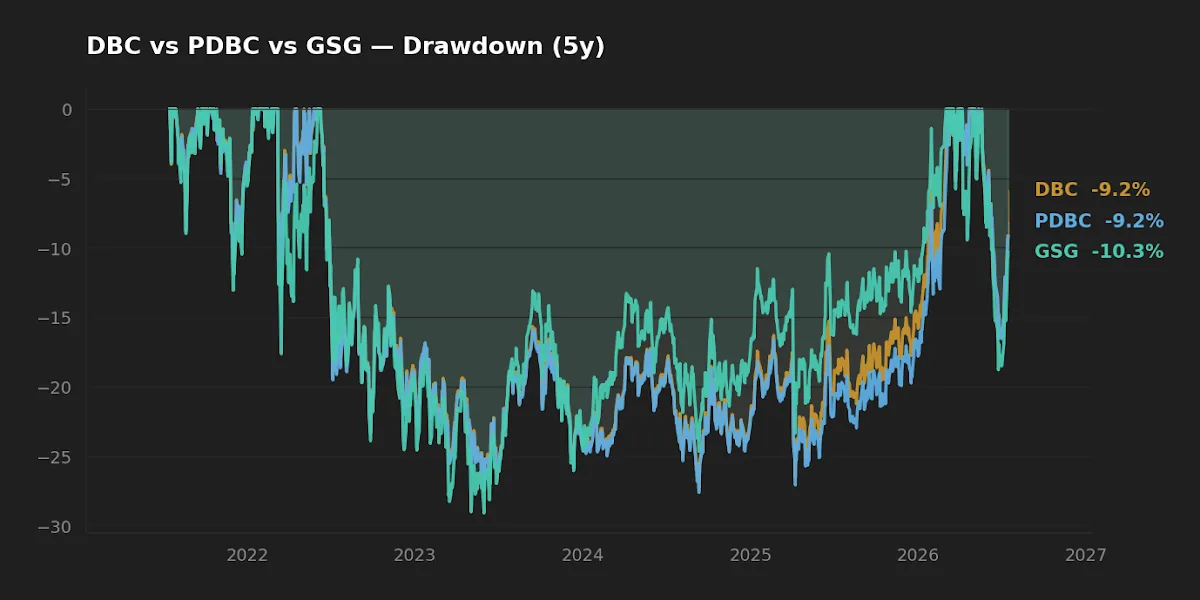
The cost of that concentration shows up exactly where you would expect it: GSG carried 22.8% realized volatility against roughly 19.2% for the DB pair, and a deeper -29.1% drawdown. Its ten-year CAGR — which spans the weak 2015–2020 commodity stretch as well as the recent boom — is actually the lowest of the three at 7.4%. That inversion between the five-year and ten-year ranking is the tell. Single-regime performance is not evidence of a better fund; it is evidence of a narrower one that happened to be pointed the right way.
GSG's five-year lead is not a better mousetrap — it is a heavier energy weight meeting a favorable energy regime, and its ten-year CAGR sits last of the three.
This is the survivorship-adjacent trap in commodity comparisons: whichever fund is most concentrated in whatever sub-sector just ran will top the trailing table. The diversified funds — DBC and PDBC — trade some of that upside for a basket that is not hostage to a single curve.
Realized risk: they crash together
The more useful observation across all three is how closely their drawdowns track. Maximum five-year drawdowns cluster between -27.3% and -29.1%. Commodities as an asset class do not offer much internal diversification when the macro driver — real rates, dollar strength, global demand — turns against them. During a genuine risk-off episode, the correlation across energy, metals, and agriculture rises, and all three funds fall together. This matters for anyone holding commodities as a supposed diversifier: the ballast works across slow inflationary cycles, not in acute drawdowns, where these funds behave like the risk assets they are.
Initially I treated the DBC-versus-PDBC choice as a rounding-error decision, since they follow near-identical optimum-yield methodologies and their five-year return, volatility, and drawdown numbers sit within a few tenths of a percent. Then the tax structure changed the ranking. It usually does.
The quiet decider: K-1 versus 1099
DBC and GSG are structured such that holders receive a Schedule K-1 at tax time — a partnership form that can complicate filing, arrives late, and can create unexpected reporting even inside some accounts. PDBC was engineered specifically to avoid this: it issues a standard 1099, which is why "No K-1" sits in its name. For a taxable long-horizon holder, that is not a cosmetic difference. It is the difference between a position that files itself and one that adds a form and a delay to every return for as long as you hold it.
Pair that with the fee: PDBC's 0.59% expense ratio is 0.26% below DBC's 0.85% and 0.16% below GSG's 0.75%. In a low-expected-return asset — and commodities are a low-expected-real-return asset over long horizons — 26 basis points of annual drag is not trivial. Faithfulness in small things is most of the edge here. PDBC also carries the largest asset base of the three at $5.3B, versus $1.6B for DBC and $0.8B for GSG, which tends to translate into tighter secondary-market spreads and lower implementation friction for the buyer. GSG's smaller $0.8B base is not a closure worry given its long track record, but it is the thinnest of the three.
The reason PDBC and DBC still both exist is largely legacy account access and the fact that some allocators simply prefer the older ticker. On the merits — fee, tax form, liquidity — PDBC is the more efficient wrapper for the same underlying strategy. Investors weighing commodities as one sleeve of a broader portfolio may find the framing in Beyond a One-ETF Equity Core and What SGOV and Gold Actually Do useful for deciding whether a commodity allocation earns its place at all.
Scoreboard
| Category | Winner | Why |
|---|---|---|
| Cost | PDBC | 0.59% vs 0.75% (GSG) and 0.85% (DBC) |
| Tax efficiency | PDBC | 1099 instead of K-1 |
| Realized 5Y return | GSG | 14.6% CAGR — but regime-driven and energy-concentrated |
| Realized risk | DBC / PDBC | Lower volatility (~19.2%) and shallower drawdown than GSG |
| Diversification | DBC / PDBC | Broader basket; GSG is energy-heavy by construction |
| Suitability (taxable core sleeve) | PDBC | Cheapest, No K-1, largest AUM / tightest spreads |
FAQ
What is roll yield, and why does it matter more than the oil price?
Roll yield is the gain or loss a futures fund realizes each time it sells an expiring contract and buys a later one. In contango (later contracts more expensive) it drags on returns; in backwardation it adds. Over long holding periods the cumulative roll can exceed the spot price change, which is why the DB funds' optimum-yield methodology — designed to minimize contango drag — is a core distinction, not a marketing line.
Is GSG a diversified commodity fund?
Nominally yes, functionally less so. The S&P GSCI weights by world production, which concentrates the basket heavily in energy. That explains GSG's higher 5Y CAGR of 14.6% during a strong energy regime, its higher 22.8% volatility, and its deeper -29.1% drawdown (yfinance, 2026-07-16). Treat it as an energy-tilted expression rather than a balanced one.
Why does PDBC exist alongside DBC if they track the same methodology?
PDBC was built to issue a 1099 instead of a K-1 tax form and carries a lower 0.59% fee versus DBC's 0.85% (Invesco fact sheets). It is the more tax-efficient and cheaper wrapper for essentially the same optimum-yield strategy.
Why do these funds pay a distribution if commodities don't yield anything?
The distributions come from the Treasury bills the funds hold as collateral against their futures, not from the commodities themselves. With the 10-year Treasury at 4.58% (FRED, asof 2026-07-14), that collateral income is meaningful — the 2.8%–3.2% yields on DBC and PDBC are mostly interest, not a commodity signal.
Do commodity ETFs actually diversify a stock-and-bond portfolio?
Across slow inflationary cycles they can, but the five-year drawdowns here all cluster near -27% to -29%, and commodities correlate more tightly with risk assets during acute sell-offs. They are a potential inflation hedge, not a crash hedge — a distinction worth being clear-eyed about before sizing a position.
What this comparison can and can't tell you
The return window here is five and ten years — a single, energy-dominated commodity cycle, not a full survey of regimes. It does not include a sustained deflationary bust or a 1970s-style secular commodity bull. Trailing CAGR rewards whichever basket was pointed the right way, which is exactly why GSG's five-year lead reverses over ten years. Treat these numbers as a description of realized behavior across one regime, not a forecast.
Scenarios where each fund fits
A reader adding a small taxable commodity sleeve, who values low friction and hates paperwork, leans toward PDBC: cheapest, No K-1, deepest liquidity. A reader who explicitly wants energy-tilted, production-weighted exposure and accepts higher volatility might reach for GSG — with eyes open that it is a concentrated bet. A reader holding DBC in an existing account may find the 0.26% fee and K-1 friction enough reason to review whether PDBC serves the same goal more cleanly.
Editor's read
If a diversified commodity sleeve earns a place at all in a long-horizon portfolio, the editor leans toward PDBC: it delivers the same optimum-yield strategy as DBC at a 0.26% lower fee, issues a 1099 instead of a K-1, and carries the largest asset base of the three for tighter execution. GSG's headline 14.6% five-year return is real but regime-specific — its energy concentration is a feature only if energy exposure is what you actually want, and its last-place ten-year CAGR is the honest counterweight.
The editor does not hold any of the three at the time of writing.
Methodology. Return, volatility, and drawdown figures were computed from daily price history via yfinance, pulled 2026-07-16, over trailing five- and ten-year windows. Expense ratios, AUM, distribution yields, inception dates, and tax structure are from the Invesco DBC and PDBC fact sheets and the iShares GSG fund page. Macro figures (10-year Treasury 4.58%, fed funds 3.63%, VIX 16.5, CPI YoY 3.7%) are from FRED, asof 2026-07-14 and 2026-06-01.
This article is for educational purposes and does not constitute personalized financial advice. See our full Disclaimer.