Photo by Daniel Brzdęk on Unsplash
The short version
- Over the trailing five years QQQ compounded at 15.6% annually while ARKK compounded at −8.1% — the two funds did not just diverge in degree, they diverged in sign.
- ARKK carried roughly double QQQ's realized volatility (46.4% vs 22.8%) and drew down 76.2% peak-to-trough, yet delivered nothing for the extra risk over this window.
- Bottom line: QQQ is a broad, rules-based Nasdaq-100 exposure that fits a long-horizon core; ARKK is a concentrated, high-variance thematic bet that only makes sense as a small, deliberately sized satellite — if at all.
The central question in any ARKK-versus-QQQ comparison is not "which returned more" — the numbers settle that decisively for the trailing five years. The more useful question is why two funds that both live in the growth-and-technology neighborhood produced returns of opposite sign, and what that divergence tells us about active thematic concentration versus rules-based index breadth. That distinction matters because it recurs every cycle, under different tickers, and the mechanism is more durable than any single fund's track record.
Context: what each fund actually is
Invesco QQQ Trust (QQQ) tracks the Nasdaq-100 — the 100 largest non-financial companies listed on the Nasdaq, weighted by a modified market capitalization scheme. It is passive, transparent, and rebalanced on a published schedule. Launched in March 1999, it is one of the most liquid equity vehicles in the world, with roughly $490B in assets under management.
ARK Innovation ETF (ARKK) is an actively managed fund built around a single thesis: "disruptive innovation." Its managers concentrate capital in a relatively small number of companies they judge to be on the steep part of an adoption curve — genomics, autonomous mobility, digital assets infrastructure, and similar themes. It launched in October 2014 and currently holds about $6.5B, roughly one-seventy-fifth of QQQ's scale. That size difference is not a footnote; it shapes behavior, as we'll see.
The two are often shelved together as "aggressive tech," but they are structurally different animals: one is a broad index wrapper, the other is a high-conviction stock-picking vehicle with a factor profile tilted hard toward long-duration, high-beta growth.
The data
| Metric | ARKK | QQQ |
|---|---|---|
| Fund | ARK Innovation ETF | Invesco QQQ Trust |
| Structure | Active, thematic | Passive, Nasdaq-100 index |
| Expense ratio | 0.75% | 0.18% |
| AUM | $6.5B | $490.1B |
| Inception | 2014-10-31 | 1999-03-10 |
| Dividend yield | 0.0% | 0.4% |
| 5Y CAGR | −8.1% | 15.6% |
| 10Y CAGR | 16.2% | 21.6% |
| 5Y volatility (annualized) | 46.4% | 22.8% |
| 5Y max drawdown | −76.2% | −35.1% |
Source: yfinance price/return data, pulled 2026-07-16; expense ratio, AUM, and dividend yield from issuer fact sheets — ARK Invest ARKK fact sheet and the Invesco QQQ fact sheet. CAGR, volatility, and drawdown figures are computed from adjusted-close total-return series over the trailing windows.
Realized return: the 10-year number hides more than it reveals
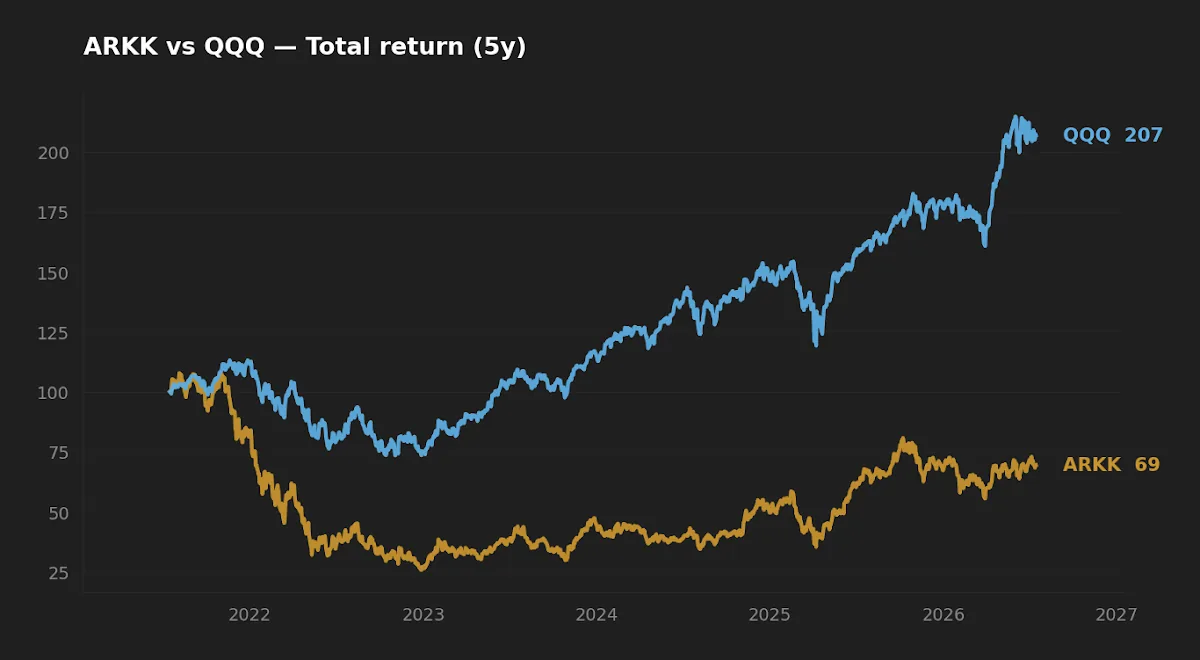
Read the table quickly and you might conclude ARKK is merely "a bit behind" — after all, its 10-year CAGR of 16.2% is respectable in absolute terms. That reading is a trap, and it's worth slowing down on.
The 10-year figure is dominated by a single regime. ARKK's cumulative return over the full decade is heavily front-loaded into the 2020–2021 liquidity surge, when zero-rate conditions rewarded exactly the long-duration, unprofitable-growth profile the fund concentrates in. Strip out or move past that episode and the trailing five years — which capture the 2022 rate-normalization shock and everything since — show a −8.1% annual compounding rate. QQQ, over the same five years, compounded at 15.6%. The 10-year averages narrow the gap only because ARKK's decade contains one extraordinary tailwind that has not repeated.
This is the look-ahead-and-single-regime problem in miniature. A backtest or a trailing-decade CAGR can make a strategy look robust when its entire edge came from one macro window. Initially I read ARKK's 16.2% ten-year number as evidence of a real, if volatile, long-run premium. Then I looked at the return path rather than the endpoint, and the premium turned out to be one regime wearing a ten-year costume.
ARKK's respectable ten-year average is one extraordinary macro window wearing a decade-long costume; the five-year record is what the strategy looks like without that tailwind.
Realized risk: volatility that wasn't paid for
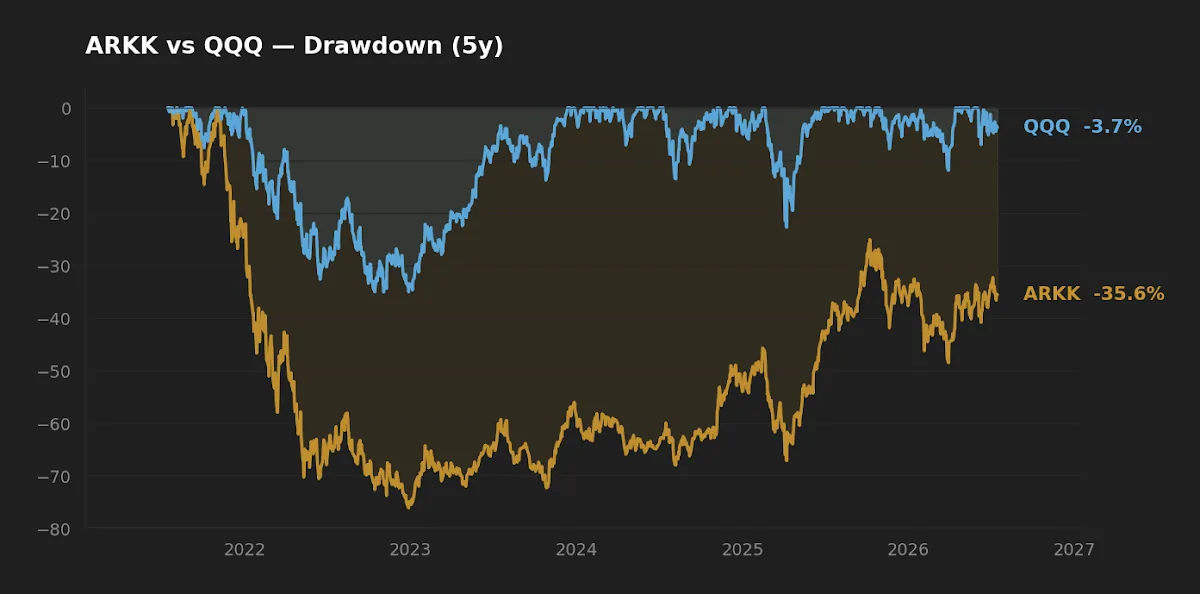
The cleaner way to judge these funds is risk-adjusted, and here the contrast is stark. ARKK's five-year annualized volatility of 46.4% is roughly double QQQ's 22.8%. Higher volatility is not automatically a defect — it is defensible when it comes with proportionally higher return. The problem is that over this window ARKK's return was negative. Investors took on twice the variance and a 76.2% peak-to-trough drawdown and received less than nothing for it. QQQ's worst five-year drawdown was −35.1% — painful, but roughly half as deep, against a positive compounding rate.
Drawdown duration compounds the damage in a way headline percentages understate. A 76% drawdown requires a 4.2x gain just to reach the prior high; a 35% drawdown requires a 1.5x recovery. The mathematics of recovery are asymmetric, and deep drawdowns tax patience precisely when conviction is hardest to hold. This is where behavior in stress does real financial harm: the investor who capitulates near a −76% mark locks in a loss that the paper drawdown alone doesn't fully capture.
The prevailing macro backdrop frames why the last five years were so unkind to ARKK's profile specifically. The 10-year Treasury sits at 4.58% and the fed funds rate at 3.63% (FRED, asof 2026-07-14 and 2026-06-01). Long-duration growth assets — those whose value rests on cash flows far in the future — are the most sensitive to a higher discount rate. QQQ holds many highly profitable, cash-generative mega-caps that partially offset that sensitivity. ARKK, by design, does not.
The non-obvious cost: scale, capacity, and reflexivity
The most interesting difference between these funds is not on the fact sheet. It is the second-order effect of ARKK's concentration combined with the liquidity of what it owns.
QQQ's holdings are among the most liquid securities on earth; a $490B fund can trade them without materially moving prices. ARKK, at $6.5B, concentrates a meaningful share of its capital in smaller, less-liquid names where its own position can represent a large fraction of a company's float. That creates a reflexive feedback loop most retail comparisons miss: when ARKK sees inflows, its buying can push up the very holdings that then report strong performance, attracting more inflows. In reverse, redemptions force selling into thin markets, depressing prices and triggering further redemptions. The fund's flows and its holdings' prices become entangled. This is a capacity-and-liquidity risk that a broad-index fund like QQQ structurally does not carry, and it means ARKK's realized volatility partly reflects its own footprint, not just the underlying businesses.
The 0.57% fee gap is the more pedestrian cost, but it is unforgiving over decades. Faithfulness in small things applies literally here: 57 basis points compounded across a multi-decade horizon is a large cumulative drag, and active management has to clear that hurdle every single year before it adds any value. For readers weighing wrapper efficiency in the same index family, the mechanics are laid out in our look at QQQ vs QQQM, and the broader "tech beta" stack is dissected in IGV vs WCLD vs QQQ.
Factor read: they are not the same bet
It is tempting to treat both as "growth," but their factor loadings differ. QQQ carries a large-cap, quality-and-profitability tilt via its mega-cap weighting — many of its top holdings score well on profitability and low-leverage metrics. ARKK loads far more heavily on small- and mid-cap, high-beta, low-profitability growth, with concentrated single-name and thematic risk. In factor language, ARKK is a leveraged bet on the speculative end of the growth spectrum; QQQ is a bet on the profitable end. That is why they behave so differently when the discount rate moves. Readers comparing QQQ to a pure sector cut will find the related dynamics in VGT vs QQQ.
Scoreboard: winner by category
| Category | Winner | Why |
|---|---|---|
| Cost | QQQ | 0.18% vs 0.75% — a 0.57% annual advantage. |
| Realized risk | QQQ | Half the volatility (22.8% vs 46.4%) and half the drawdown (−35.1% vs −76.2%). |
| Realized return (5Y) | QQQ | +15.6% vs −8.1% annualized. |
| Suitability as long-horizon core | QQQ | Broad, liquid, rules-based; ARKK is a satellite instrument at most. |
FAQ
Is ARKK a bad fund because it lost money over five years? Not necessarily "bad" — but it is a high-variance thematic vehicle whose entire recent track record depended on one favorable macro regime. The five-year data shows the risk was not compensated over this window. Past return, good or bad, does not predict the next window; the structural risks (concentration, capacity, fee) are the more durable facts.
Does QQQ's higher 10-year CAGR mean it always beats ARKK? No. Over 2020–2021 ARKK dramatically outperformed. The point is not that one always wins but that ARKK's outperformance clustered in a single liquidity regime, while QQQ delivered more consistent compounding across the full cycle.
Why does ARKK charge 0.75% when QQQ charges 0.18%? ARKK is actively managed — the fee pays for the managers' research and stock selection. Active management can, in principle, justify a higher fee, but it must overcome that 0.57% annual drag before adding value, a hurdle it has not cleared over the trailing five years.
Are these two funds redundant if I hold both? Less than they appear. They share a growth theme but differ sharply in factor exposure — QQQ tilts toward profitable mega-caps, ARKK toward speculative small- and mid-caps. Holding both is a barbell, not a duplication, though the overlap is non-trivial.
How does the current rate environment affect the comparison? With the 10-year Treasury at 4.58% (FRED, asof 2026-07-14), long-duration, unprofitable growth — ARKK's core exposure — faces a stiffer discount-rate headwind than QQQ's profitable mega-caps. A sustained decline in rates would tend to favor ARKK's profile more than QQQ's.
What this comparison can and can't tell you
It can tell you how each fund behaved across one full cycle — a rate-normalization shock and its aftermath — on realized return, volatility, and drawdown, using total-return price data. It cannot tell you which will lead the next cycle. Five years is a short sample dominated by a single macro regime; it does not include a prolonged low-rate growth boom of the kind that would flatter ARKK. The figures also exclude tax treatment, bid-ask spreads (which matter more for smaller-AUM active funds), and the tracking behavior of ARKK's less-liquid holdings under stress. Treat the numbers as a description of the recent past, not a forecast.
Scenarios where each fund fits
Reader in their 30s, 401(k)-only, building a long-horizon core with no current Nasdaq exposure → QQQ is the far more defensible core holding; its breadth, cost, and liquidity suit a multi-decade hold, though even QQQ is a concentrated large-cap-growth tilt, not a total-market position (see VOO vs VTI for the breadth trade-off).
Reader with a diversified core already in place, who wants a small, explicitly speculative innovation tilt and can tolerate a 70%+ drawdown without capitulating → ARKK could serve as a deliberately sized satellite (a few percent of the portfolio), understood as a high-variance bet, not a hold-and-forget position. The discipline is in the sizing and the pre-commitment to hold through the drawdown — behavior in stress is where this position is won or lost. For related thinking on staying invested through volatility, see Buy the Dip or Stay Invested?
Editor's read
If forced to pick one for the long-horizon core, the editor leans firmly toward QQQ: it won cost, realized risk, and realized return over the full cycle, and its structure — broad, liquid, rules-based — is the kind that rewards patience without demanding heroic conviction. ARKK is genuinely interesting as a small, clearly labeled satellite for an investor who understands they are buying the speculative end of the growth spectrum and has pre-committed to holding through a drawdown that has already touched −76%. The mistake to avoid is treating ARKK's ten-year average as evidence of a durable premium; the five-year record is the more honest picture of the strategy without its 2020 tailwind.
The editor holds a Nasdaq-100 index position; does not hold ARKK at the time of writing.
Methodology. Price and total-return series via yfinance, pulled 2026-07-16; CAGR, annualized volatility, and maximum drawdown computed from adjusted-close data over the trailing 5- and 10-year windows. Expense ratio, AUM, and dividend yield from issuer fact sheets (ARK Invest; Invesco). Macro figures from FRED: 10-year Treasury 4.58% (asof 2026-07-14), fed funds 3.63% (asof 2026-06-01), VIX 16.5 (asof 2026-07-14), CPI YoY 3.7% (asof 2026-06-01).
This article is for educational purposes and does not constitute personalized financial advice. See our full Disclaimer.