Photo by Bozhin Karaivanov on Unsplash
The short version
- A semiconductor ETF is not one bet — it is a weighted basket of four different businesses (memory, logic/design, foundry, equipment) that peak and trough on different clocks.
- SMH and SOXX posted near-identical realized volatility and drawdown over five years, yet SMH's 5Y CAGR ran about 4.9 points higher — the gap is concentration, not extra risk premium.
- Bottom line: both are cap-and-liquidity tilted toward logic/design, which is why a memory-led cycle rarely shows up in these funds the way a pure memory index would.
The central question of this article is narrow and practical: when you buy a semiconductor ETF, what are you actually holding, and why did two funds tracking the same industry diverge by almost five percentage points a year while carrying nearly the same risk? The answer is not luck. It is index construction meeting an industry that is really four industries in a trench coat.
That distinction matters because the label "semiconductors" hides very different economic engines. Memory behaves like a commodity. Foundry behaves like heavy infrastructure. Equipment behaves like a capital-goods supplier. Logic and design behaves like the closest thing the sector has to a software margin profile. Owning one blended ticker means owning a fixed opinion about how those four should be weighted — and most investors never examine that opinion.
Context: the value chain in ninety seconds
A modern chip passes through four broad stages, each with its own cyclicality:
- Memory (DRAM and NAND — Samsung, SK Hynix, Micron). The most commodity-like sleeve. Pricing swings hard with supply gluts and shortages, so earnings are the most cyclical in the chain.
- Logic and design (Nvidia, AMD, Broadcom, and other fabless designers). Higher gross margins, IP-driven, and the primary beneficiary of the AI compute build-out. This is where the last cycle's premium concentrated.
- Foundry (TSMC as the dominant contract manufacturer). Enormous fixed capital, long build cycles, and a near-utility position in the supply chain — but subject to geopolitical and capacity risk.
- Equipment (ASML, Applied Materials, Lam Research). Sells the tools that build the fabs. Revenue lags the capex decisions of foundry and memory makers, so it cycles later and differently from the chips themselves.
Because these sleeves do not move together, the weighting rule inside an ETF is not a footnote — it is the product. Two funds can track "semiconductors" and still express materially different bets on which stage of the chain drives returns.
The two funds, side by side
SMH (VanEck) and SOXX (iShares) are the two largest US-listed semiconductor ETFs. The table below uses price and return figures computed from yfinance data pulled 2026-07-22; expense ratio, AUM, and inception come from the issuer fact sheets (VanEck SMH, iShares SOXX).
| Metric | SMH | SOXX |
|---|---|---|
| Name | VanEck Semiconductor | iShares Semiconductor |
| Expense ratio | 0.35% | 0.34% |
| AUM | $77.2B | $47.8B |
| Inception | 2011-12-20 | 2001-07-10 |
| Dividend yield | 0.2% | 0.2% |
| 5Y CAGR | 36.0% | 31.1% |
| 10Y CAGR | 35.9% | 34.0% |
| 5Y annualized volatility | 36.2% | 37.9% |
| Max drawdown (5Y) | −45.3% | −45.8% |
Yields round to roughly 0.2% for both (0.17% SMH, 0.23% SOXX) — a rounding error against the 10-year Treasury at 4.6% (FRED, asof 2026-07-20). Neither fund is an income instrument, and anyone framing them that way has misread the mandate.
Why SMH pulled ahead without taking more risk
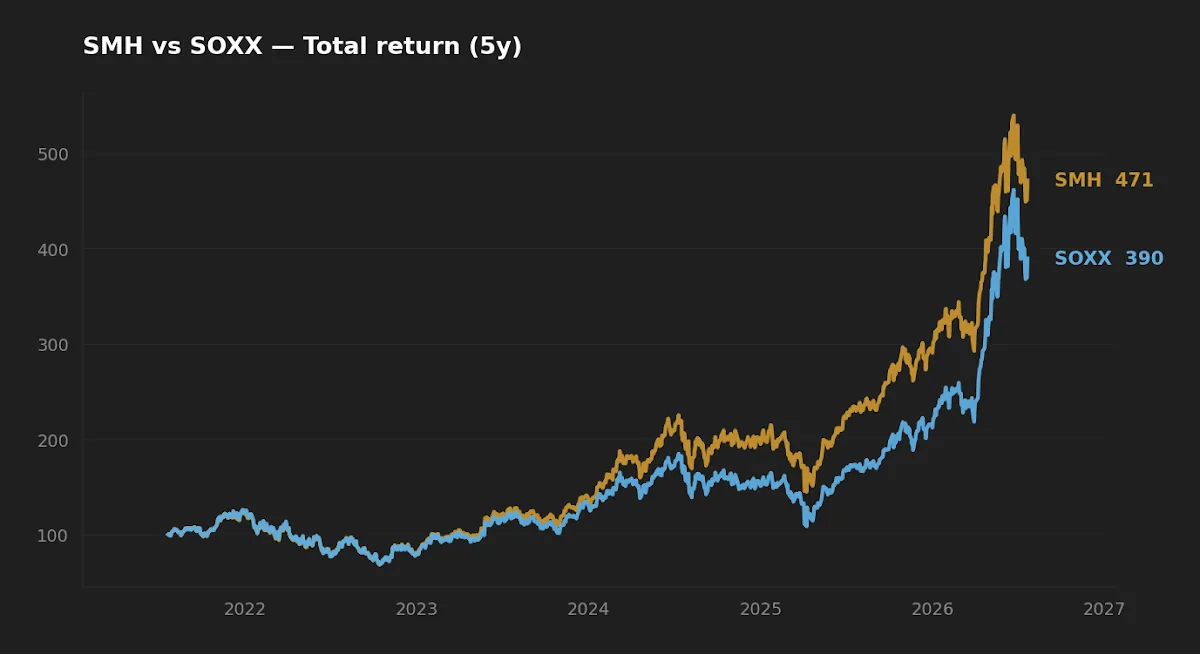
Here is the part worth slowing down on. Over five years SMH compounded at 36.0% and SOXX at 31.1% — a 4.9-point annual gap. But SMH's realized volatility (36.2%) was slightly lower than SOXX's (37.9%), and its maximum drawdown (−45.3%) was marginally shallower than SOXX's (−45.8%). More return, not more measured risk.
The usual explanation for a return gap is a risk premium: the fund that earned more must have taken more risk somewhere. The data does not support that story here. The likelier driver is index construction. SMH's methodology allows heavier weight in its largest holdings and runs a more concentrated book of roughly two dozen names; SOXX historically holds a broader set with weighting rules that spread exposure further down the roster. In a cycle where the top logic/design and foundry names — the AI beneficiaries — did the heavy lifting, the more concentrated fund simply had more of its capital parked on the winners.
Nearly identical volatility and drawdown, but a five-point return gap — the difference is where the weight sits, not how much risk was taken.
That is a subtle but important reframing. The excess return SMH delivered is a concentration outcome, and concentration is symmetric: the same weighting rule that amplified the AI-led run would amplify a top-heavy decline. The five-year window happened to reward it. A different regime — one where the leadership rotated down the cap ladder, or where the largest single name derated — would flatter SOXX's wider spread instead. If the concept of leadership shifting between segments is unfamiliar, it is worth reading what market rotation actually means for long-horizon investors.
Realized risk: what a −45% drawdown demands
Both funds drew down roughly 45% at their worst point over the trailing five years (−45.3% SMH, −45.8% SOXX). The arithmetic of recovery is unforgiving: a 45% decline requires an 82% gain just to return to the prior high. That is not a footnote for a satellite position sized at a few percent of a portfolio; it is a structural feature of any single-industry equity fund carrying ~36% annualized volatility.
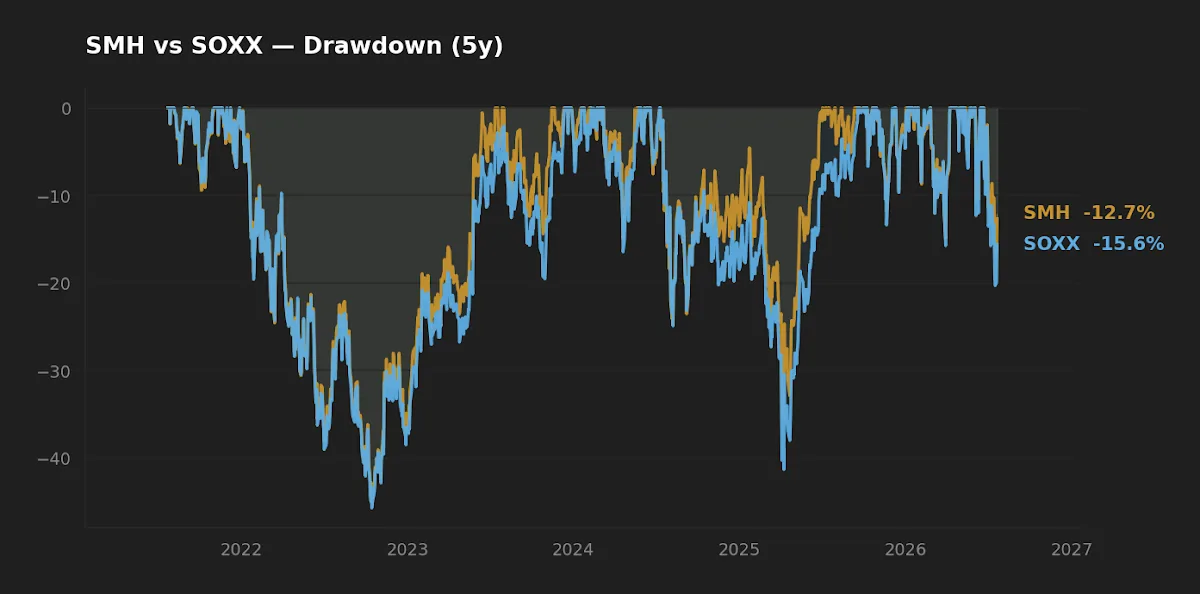
Context helps calibrate. With the VIX near 18.7 (FRED, asof 2026-07-20), broad-market implied volatility sits in a fairly ordinary range — yet these funds carry twice the realized volatility of a total-market index. The risk here is idiosyncratic to the sector, not the macro tape. For readers weighing how a drawdown of this size interacts with position sizing and recovery time, the arithmetic of a deep drawdown is the more general treatment.
The insight the blended ticker hides
Both ETFs are, in effect, tilted toward logic/design and foundry because those are the largest and most liquid names, and cap-and-liquidity weighting follows the money. That produces a non-obvious consequence: the most cyclical part of the chain — memory — is systematically underrepresented relative to its economic swing.
When the 2026 memory-and-AI cycle turned, a pure DRAM/NAND index would have shown far sharper earnings compression than either ETF did, because memory pricing moves like a commodity. But SMH and SOXX cushion that: memory is present, yet its weight is small next to the logic and foundry giants. The blended ticker quietly damps the sleeve with the wildest earnings cyclicality and amplifies the sleeve with the AI premium. Investors reaching for "semiconductor exposure" to play a memory upcycle are often buying the wrong instrument — the fund's weighting works against that specific thesis. Initially I assumed the two funds would differ mainly on fees; the rolling comparison made clear the real fork is which stage of the value chain the weighting rule emphasizes.
Scoreboard
| Category | Edge | Basis |
|---|---|---|
| Cost | SOXX (marginal) | 0.34% vs 0.35% — one basis point, effectively a tie |
| Realized risk | Tie | Volatility and max drawdown within ~1.7 and ~0.5 points |
| Realized return (5Y) | SMH | 36.0% vs 31.1% CAGR — concentration-driven |
| Diversification | SOXX | Broader roster, lower single-name concentration |
| Suitability | Depends | Concentration preference decides, not cost |
FAQ
Are SMH and SOXX basically the same fund? No. They cover the same industry and charge nearly identical fees (0.35% vs 0.34%), but SMH runs a more concentrated book that leans harder into its largest holdings, while SOXX spreads exposure across a wider roster. That difference produced most of the 4.9-point 5Y CAGR gap.
Which one is "safer"? Neither, in any meaningful sense. Both carried ~36–38% annualized volatility and drew down roughly 45% over five years. SOXX's wider diversification reduces single-name risk slightly; that is a nuance, not a safety margin.
Do these funds give me exposure to memory makers like Micron or SK Hynix? Yes, but a small slice. Both funds are weighted toward the largest, most liquid logic/design and foundry names, so memory — the most cyclical sleeve — is present but underweight relative to its earnings swing.
Should I hold one as a core position? Single-industry funds are satellite instruments by construction. A ~45% drawdown needs an 82% recovery. How a concentrated sector sleeve interacts with a diversified base is discussed in this look at five-year risk and return across a long-term core.
Why is the dividend yield so low? Both yield around 0.2%, versus the 10-year Treasury at 4.6% (FRED, asof 2026-07-20). These are total-return growth vehicles; income is immaterial to the thesis.
What this comparison can and can't tell you
The return and risk figures cover a trailing five- and ten-year window that was dominated by a single, unusually strong AI-and-compute regime. That is a small number of non-overlapping cycles. The data cannot tell you how either fund behaves through a prolonged semiconductor down-cycle, a memory glut, or a foundry supply shock, because the window barely contains one. Concentration helped SMH here; it is not a permanent edge, and the same mechanism can invert. Treat the CAGR gap as regime-specific evidence, not a structural law.
Scenarios where each fund fits
- Investor wanting maximum exposure to the AI-compute leaders, comfortable with concentration: SMH's weighting has historically expressed that tilt more directly.
- Investor wanting sector exposure with less reliance on a handful of top names: SOXX's broader roster spreads single-name risk.
- Investor sizing a small satellite (a few percent) alongside a diversified core: the one-basis-point fee difference is irrelevant; the choice reduces to how much concentration you want.
- Investor trying to play a memory upcycle specifically: neither fund is the clean instrument — both underweight memory relative to its cyclicality.
Editor's read
If the goal is a small, deliberately concentrated satellite bet on the AI-compute leaders, SMH's construction has expressed that thesis more directly, and its five-year record reflects it. But the honest reading is that the return gap is a concentration outcome, not a free lunch — the same weighting that rewarded SMH in this regime is what would deepen its fall in a top-heavy correction. For an investor who prefers exposure spread across the roster rather than a bet on a few names, SOXX is the more temperate choice at effectively the same cost. The decision is about how much concentration you are willing to hold through a −45% drawdown, not about a basis point of fee.
The editor does not hold either fund at the time of writing.
Methodology. Price and return figures (5Y/10Y CAGR, annualized volatility, maximum drawdown) were computed from daily adjusted-close data via yfinance, pulled 2026-07-22. Expense ratio, AUM, inception date, and dividend yield are from the issuer fact sheets (VanEck, iShares) as of the same date. Macro figures (10-year Treasury 4.6%, fed funds 3.63%, VIX 18.65, CPI 3.7% YoY) are from FRED, with reference dates between 2026-06-01 and 2026-07-20. Charts illustrate the trailing five-year normalized total-return and drawdown paths from the same dataset.
This article is for educational purposes and does not constitute personalized financial advice. See our full Disclaimer.