
Photo by Markus Spiske on Unsplash
The short version
- Momentum earns a long-run premium but carries deep negative skew: the strategy's worst days cluster together and arrive precisely when a crowded trade unwinds.
- Over the trailing five years, MTUM compounded slightly faster than SPY (14.2% vs 12.9%) but did so with a materially deeper drawdown (−32.3% vs −24.5%) — the return was rented, not owned outright.
- Bottom line: momentum is a satellite tilt with a known failure mode, not a set-and-forget core. Whether it fits depends on your tolerance for state-dependent crash risk.
Momentum is one of the most robustly documented anomalies in asset pricing — and one of the most treacherous to hold. The central question for a long-horizon investor is not "does momentum work?" (it does, across decades and markets) but "what does it cost you in the moments it stops working?" That cost is not evenly distributed. It concentrates.
This piece uses the iShares MSCI USA Momentum Factor ETF (MTUM) against the S&P 500 (SPY) as a live lens on the academic anatomy of a momentum crash. The numbers below are recent — the pattern they illustrate is not.
Context: what momentum actually is, in 90 seconds
A momentum strategy buys what has recently outperformed and underweights what has recently lagged. MTUM implements a rules-based version of this: it ranks large- and mid-cap U.S. stocks by risk-adjusted price momentum (typically 6- and 12-month returns, scaled by volatility) and reconstitutes on a semiannual schedule, with an ad hoc rebalance permitted after volatility spikes. It is not a manager's hunch; it is a mechanical screen.
The premium is real. Momentum survives out-of-sample, internationally, and across asset classes — the work of Asness, Frazzini and Pedersen extended the original Fama-French factor zoo to show its breadth. But momentum's return distribution is the problem. It is not symmetric. The strategy behaves like it is quietly selling insurance: long stretches of steady gains, punctuated by rare, violent losses. Barroso and Santa-Clara's 2015 paper "Momentum Has Its Moments" quantified this negative skew directly; Daniel and Moskowitz's "Momentum Crashes" (2016) mapped when the losses strike. Both matter for anyone deciding how much momentum to own. For the mechanics of factor exposure more broadly, our note on why factor investing still works in the AI era is a useful companion.
The data: MTUM vs SPY, five and ten years
| Metric | MTUM | SPY |
|---|---|---|
| Fund | iShares MSCI USA Momentum Factor | SPDR S&P 500 Trust |
| Expense ratio | 0.15% | 0.09% |
| AUM | $29.0B | $781.2B |
| Inception | 2013-04-16 | 1993-01-22 |
| Dividend yield | 0.5% | 1.0% |
| 5Y CAGR | 14.2% | 12.9% |
| 10Y CAGR | 16.3% | 15.1% |
| 5Y annualized volatility | 21.6% | 17.2% |
| 5Y max drawdown | −32.3% | −24.5% |
Return figures are computed from adjusted daily closes via yfinance, pulled 2026-07-22. Expense ratio, AUM, and yield are from issuer fact sheets: iShares MTUM and SSGA SPY.
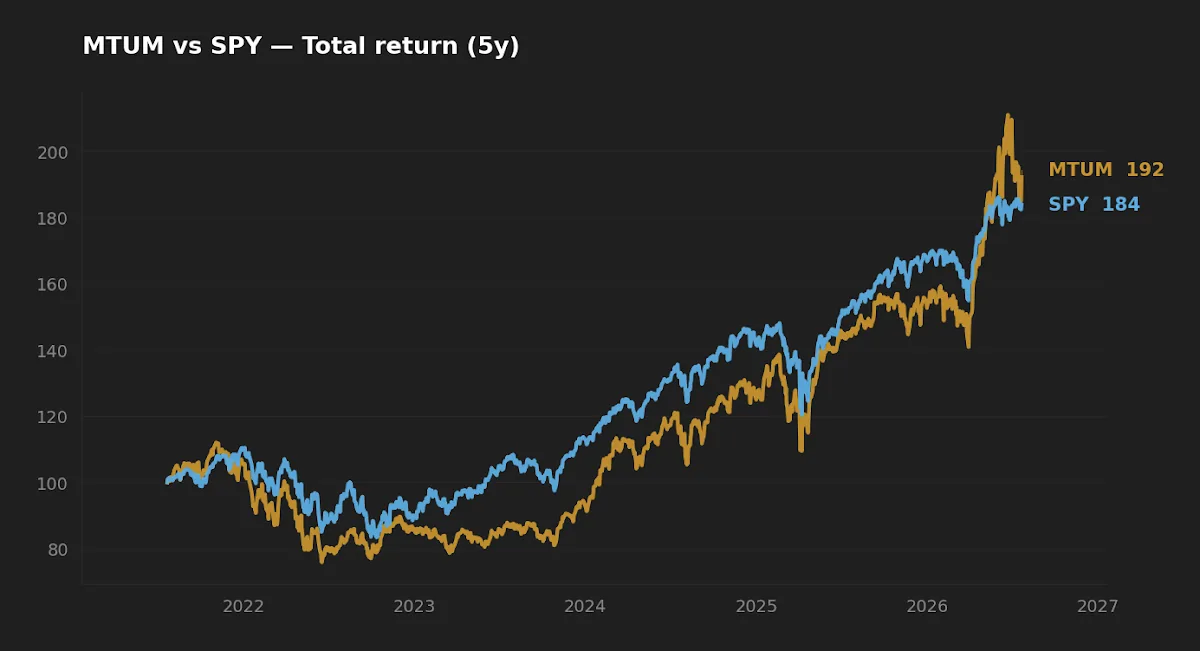
Read the table as a package, not a scoreboard. MTUM's 130 basis points of excess 5-year CAGR came bundled with roughly 440 basis points of extra annualized volatility and a drawdown nearly eight percentage points deeper. On a naive Sharpe basis the two are far closer than the headline CAGR suggests — and Sharpe itself understates the problem, because it treats a symmetric distribution. Momentum's is not symmetric.
Why the most crowded trades unwind fastest
A momentum book is, by construction, long whatever has already run. When a theme runs long enough — semiconductors and AI infrastructure being the obvious recent case — the momentum screen loads into exactly the names that discretionary managers, trend CTAs, and index-chasing flows already own. The trade becomes crowded not because anyone coordinated it but because independent rules converge on the same winners.
Crowding changes the exit dynamics. When positioning is one-sided, there are few natural buyers on the other side of a sell-off. A modest fundamental disappointment forces the first wave of deleveraging; that selling moves price; the move trips volatility-targeting and risk-parity stops; those stops force more selling. The unwind is fast precisely because everyone is standing on the same side of the boat. This is the reflexive core of a momentum crash — the strategy's own popularity manufactures the fragility.
Daniel and Moskowitz added the crucial state-dependence: momentum crashes are not random. They cluster in panic states — typically after a market has already fallen sharply and volatility is elevated — when the short leg (past losers) rebounds violently off a bottom. A long-only vehicle like MTUM avoids the explosive short-side loss, but it inherits the mirror image: it is caught holding yesterday's leaders into the reversal, having rotated out of the very names about to lead the recovery. The semiannual reconstruction schedule can make this worse, not better — the fund often buys a theme after it is already crowded and sells it after the damage is done.
Momentum's popularity is not incidental to its crash risk — it is the mechanism. The trade unwinds fastest exactly because everyone independently arrived at the same position.
Realized risk: what the drawdown actually looked like
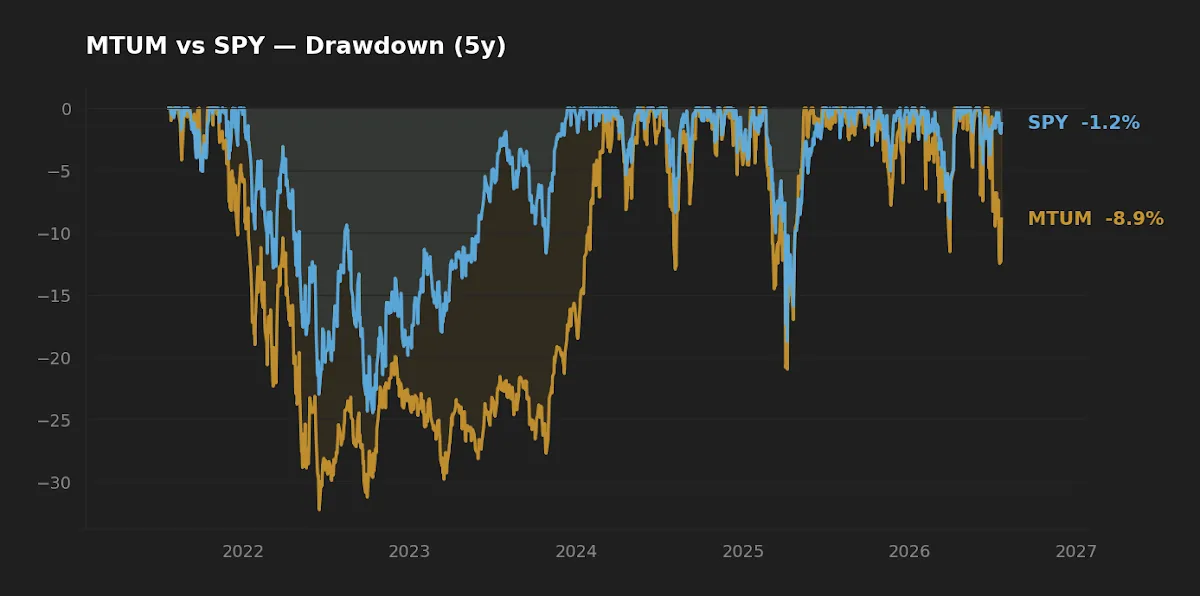
The −32.3% trailing-5-year drawdown for MTUM against SPY's −24.5% is the negative skew made concrete. It is worth being honest about what this figure can and cannot capture: a single 5-year window contains one or two real stress episodes, which is a small sample. It does not include 2008, when a long-only momentum sleeve would have behaved very differently, nor the sharp early-2009 reversal that is the textbook momentum-crash observation. Live drawdown data flatters recent momentum relative to the full historical record.
The current regime is not obviously a panic state. With the VIX at 18.7, the 10-year Treasury at 4.6%, and CPI running at 3.7% year over year (FRED, asof 2026-07-20 for VIX and yields, 2026-06-01 for CPI), volatility sits near its long-run median. Momentum tends to perform well in exactly these calm, trending conditions — which is precisely why its crash risk is easy to forget. The premium is collected in the quiet and paid back in the storm. Investors who ignore this asymmetry are effectively assuming the calm persists; those who think about sequence-of-returns risk already know why that assumption is dangerous near a spending phase.
Factor decay and the volatility-managed answer
There is a second, slower erosion working against a naive momentum allocation. McLean and Pontiff's 2016 study found that published anomalies decay meaningfully out-of-sample — on the order of 26% to 58% lower returns after the research becomes public — as capital crowds in. Momentum has not disappeared, but the raw factor an investor captures today is likely thinner than the backtests that popularized it. This is the live-versus-backtest gap that every factor product carries and few marketing sheets mention.
The academic response to the crash problem is not to abandon momentum but to size it dynamically. Barroso and Santa-Clara showed that scaling exposure inversely to recent momentum volatility — cutting risk when the strategy's own volatility spikes — roughly doubled the historical Sharpe ratio and cut the worst crashes substantially. The intuition is that momentum crashes are somewhat forecastable through volatility, so a rules-based investor can lean away before the worst of it. MTUM's design nods at this with its volatility-scaled ranking and conditional rebalance, but it is a long-only, semiannually reconstituted vehicle, not a fully volatility-managed strategy. The distinction matters: it captures much of the premium but retains most of the tail. For how a machine-learning variant reweights the same signal, see our comparison of how AMOM weights momentum differently from MTUM.
Initially I expected MTUM's drawdown to track SPY's fairly closely, given both are long-only large-cap U.S. baskets. Then I looked at the realized volatility gap — 21.6% versus 17.2% — and the deeper trough followed directly from it. The extra return is not free alpha; it is compensation for holding a fatter left tail.
| Category | Winner | Why |
|---|---|---|
| Cost | SPY | 0.09% vs 0.15%; a ~6 bp edge compounds quietly. |
| Realized risk | SPY | Lower volatility (17.2%) and shallower drawdown (−24.5%). |
| Realized return | MTUM | Higher 5Y and 10Y CAGR — but risk-adjusted, the gap narrows sharply. |
| Suitability as core | SPY | Broad, cheap, symmetric enough for a long-horizon core sleeve. |
FAQ
Is MTUM a good replacement for an S&P 500 fund? They are not substitutes. MTUM is a concentrated tilt toward recent winners with meaningfully higher volatility; SPY is a diversified market-cap benchmark. Treating a factor tilt as a core holding exposes you to a crash profile the benchmark does not have.
What causes a momentum crash? A crowded, one-sided position meets a catalyst, forced deleveraging cascades through volatility-targeting strategies, and — per Daniel and Moskowitz — past losers rebound violently while the momentum book is still holding yesterday's leaders. The unwind is fast because positioning is concentrated.
Does the momentum premium still exist after so much research? Evidence says yes, but attenuated. McLean and Pontiff document material out-of-sample decay for published anomalies as capital crowds in. Momentum persists; the raw edge is likely thinner than older backtests imply.
Why is MTUM's dividend yield so low? At 0.5% versus SPY's 1.0% (issuer fact sheets), MTUM tilts toward higher-momentum growth names that distribute less. Its return is expected to come from price appreciation, which is also part of why its distribution is more volatile.
How much momentum should a long-term portfolio hold? There is no universal answer, and this is not advice. The academic literature treats momentum as a satellite tilt sized to a fraction of a portfolio, often paired with a value tilt to offset its worst regimes, and governed by disciplined rebalancing bands so the position cannot quietly balloon during a run.
Key takeaways
- Momentum's long-run premium is real but arrives with negative skew — steady gains interrupted by rare, deep losses (Barroso & Santa-Clara 2015; Daniel & Moskowitz 2016).
- Over the trailing five years MTUM out-compounded SPY (14.2% vs 12.9%) but with higher volatility (21.6% vs 17.2%) and a deeper drawdown (−32.3% vs −24.5%). Risk-adjusted, the gap is modest.
- Crashes are state-dependent and crowding-driven: the trade unwinds fastest because independent rules converge on the same positions.
- Published-anomaly decay (McLean & Pontiff 2016) means today's captured premium is likely thinner than the backtests suggest.
- Volatility-managed sizing mitigates the tail; a long-only, semiannually rebalanced fund captures the premium but keeps most of the crash risk.
Editor's read
Momentum earns its place in the academic canon, but the realized 32% drawdown is the whole story in one number: the extra return is rent paid for holding a fat left tail, not a gift. If momentum belongs anywhere in a long-horizon plan, it is as a modestly sized satellite tilt — bounded by rebalancing discipline and ideally paired with an offsetting exposure — never as a core substitute for a broad, cheap benchmark. The current calm regime is exactly when that discipline is hardest to keep and most valuable.
Disclosure: The editor does not hold MTUM at the time of writing and maintains broad-market index exposure comparable to SPY.
Methodology: Price and return series (5Y/10Y CAGR, annualized volatility, maximum drawdown) computed from adjusted daily closes via yfinance, pulled 2026-07-22; window analyzed is the trailing 5 and 10 years to that date. Expense ratio, AUM, dividend yield, and inception from issuer fact sheets (iShares, SSGA). Macro figures from FRED (10Y Treasury and VIX asof 2026-07-20; fed funds and CPI asof 2026-06-01).
This article is for educational purposes and does not constitute personalized financial advice. See our full Disclaimer.