
Photo by Milad Fakurian on Unsplash
The short version
- Rebalancing bands turn a drawdown into a mechanical instruction — trim what held, add to what fell — without requiring you to identify the bottom.
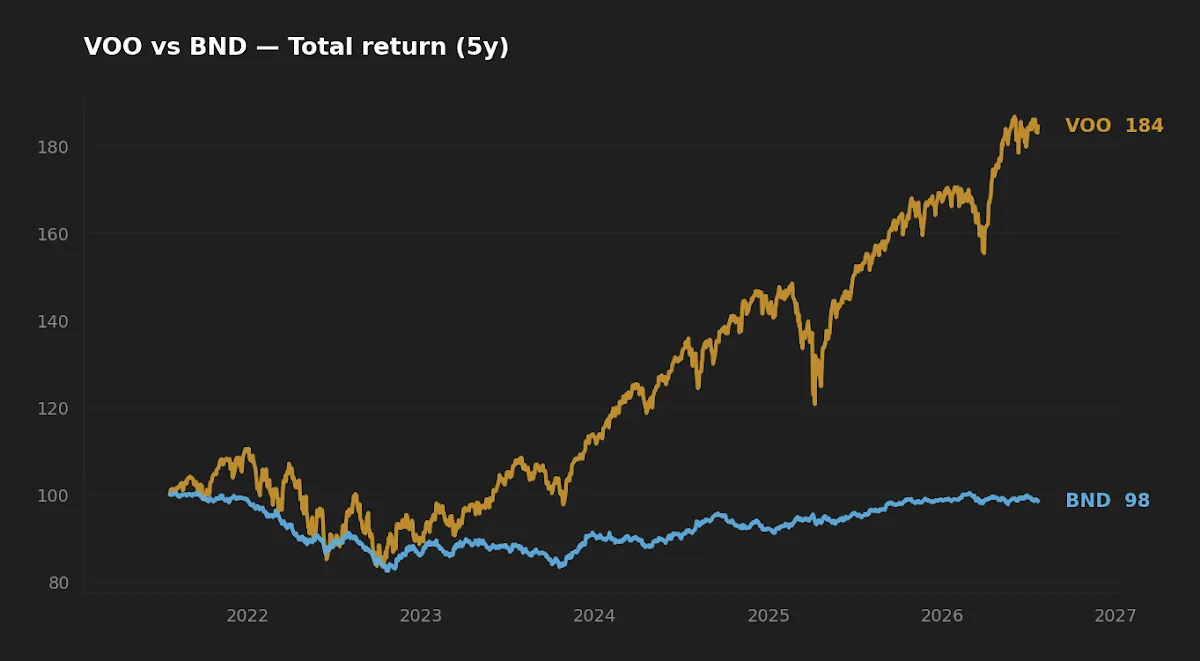
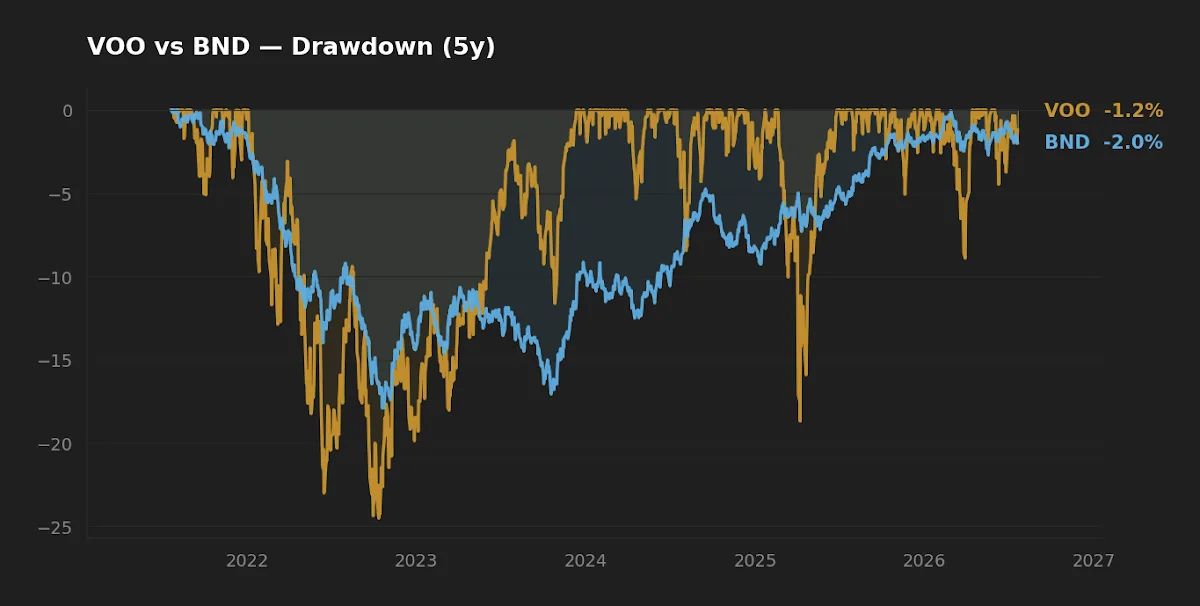
- Over the trailing five years VOO returned about 13.0% annualized against a −24.5% worst drawdown, while BND lost roughly 0.2% annualized with a −17.9% drawdown; the two rarely bottom on the same day, which is the entire point of holding both.
- Bottom line: a stock/bond pair with defined tolerance bands gives you a rule to act on when conviction is lowest — the moment forecasting fails most people.
A sharp selloff — the 2026 chip-sector unwind being the most recent example — presents every long-horizon investor with the same problem: your equity sleeve is now underweight, and every instinct says wait for confirmation before adding. The trouble is that confirmation and the bottom never arrive together. This article is about a rules-based alternative that sidesteps the forecast entirely: rebalancing bands applied to a two-fund stock/bond pair, using VOO and BND as the worked example.
The 90-second orientation
Rebalancing is the act of returning a portfolio to its target weights after markets have moved them. If you hold a 60/40 split of equities to bonds and equities fall 25%, your mix drifts toward roughly 54/46. Mechanically restoring 60/40 forces you to sell the asset that held (bonds) and buy the asset that fell (equities) — you buy weakness and trim strength as a byproduct of the arithmetic, not as a market call.
The academic backbone here is Gobind Daryanani's 2008 Journal of Financial Planning work on rebalancing bands, later echoed by Vanguard's research (2024) on tolerance-band methods. The finding is not that rebalancing maximizes return — it usually does not versus a static equity-heavy sleeve in a rising market — but that band-triggered rebalancing captures most of the risk-control benefit while trading far less often than calendar rebalancing. Daryanani's key contribution was showing that wider bands, checked frequently, beat narrow bands checked rarely. The common implementations are an absolute ±5 percentage-point band or a relative ±25% band around each target weight.
What the two funds actually are
The data below is pulled from yfinance for price-derived fields (NAV, CAGR, volatility, drawdown) on 2026-07-22, and from Vanguard issuer fact sheets for expense ratio, AUM, and yield. CAGR figures are trailing annualized total returns over the stated window; drawdown is the worst peak-to-trough decline inside the trailing five years.
| Field | VOO | BND |
|---|---|---|
| Name | Vanguard S&P 500 ETF | Vanguard Total Bond Market ETF |
| Expense ratio | 0.03% | 0.03% |
| AUM | $1,670.9B | $397.9B |
| Distribution yield | 1.1% | 4.0% |
| Fund data inception | 2016-06-24 | 2007-04-03 |
| NAV | $681.85 | $72.66 |
| 5Y CAGR | 13.0% | −0.2% |
| 10Y CAGR | 15.2% | 1.5% |
| 5Y volatility | 16.9% | 6.0% |
| 5Y max drawdown | −24.5% | −17.9% |
Sources: yfinance (price/return fields, pulled 2026-07-22); Vanguard fact sheets for VOO and BND (expense ratio, AUM, yield).
Why bands beat guessing
The forecasting approach asks a question you cannot answer: is this the bottom? The band approach asks a question the arithmetic answers for you: has the drift exceeded my tolerance? A relative ±25% band on a 60% equity target triggers when equities fall to roughly 45% of the portfolio or rise to about 75%. You are not predicting; you are responding to a measured breach.
There is a subtler benefit that the return numbers hide. A drawdown is precisely when equities are cheapest relative to their own recent path, and precisely when human conviction is lowest. The band converts that low-conviction moment into a pre-committed instruction written when you were calm. Daryanani framed rebalancing's edge as a "rebalancing bonus" harvested from volatility; the more honest framing is that the bonus is behavioral as much as mathematical — it forces the trade most investors talk themselves out of.
A tolerance band is a decision you make while calm and execute while afraid — which is the only sequence that reliably works.
Contrast this with performance-chasing, which does the opposite: it adds to what has already risen and abandons what has fallen. Chasing feels like momentum discipline; mechanically it is a portfolio that buys high and sells low on a lag. The band is the structural antidote because its trigger points are symmetric — it trims the same strength that a chaser is buying.
Realized risk: the two funds do not bottom together
The reason a stock/bond pair works as a rebalancing engine is that the two legs draw down on different schedules and for different reasons. VOO's −24.5% trough over the trailing five years was an equity-risk event; BND's −17.9% trough was a rates event, driven by the fastest hiking cycle in four decades. Those are distinct shocks. When one leg is falling, the other is frequently the source of dry powder to buy it — which is exactly what a rebalance does.
One number deserves a caveat rather than applause. BND's −0.2% five-year CAGR is not a broken fund; it is what a high-quality bond index does through a historic rate repricing. With the 10-year Treasury at 4.6% and the fed funds rate at 3.63% (FRED, asof 2026-07-20 and 2026-06-01), BND's 4.0% distribution yield is now doing real work — the starting yield, not the trailing return, is the better estimate of a bond fund's forward return. Initially I read the flat five-year line as a reason to under-weight bonds. Then I looked at the yield-to-maturity reset: the asset that hurt on the way up is repriced to pay more on the way forward. That asymmetry is easy to miss if you only read the CAGR column.
Implementation friction most plans skip
Bands are clean in theory and leaky in practice. Three frictions matter. First, taxes: rebalancing in a taxable account realizes gains, so the band trade that buys equities by selling bonds is cheapest when the selling leg has little embedded gain — which, after a bond drawdown, it often does. Second, cash flows: new contributions and the 1.1% and 4.0% distributions can be steered toward the underweight leg, rebalancing without selling anything, which is the lowest-cost path. Third, band width itself is a cost lever — narrow bands trade more, incur more spread and tax, and Daryanani's own finding is that width buys you cheaper discipline with negligible loss of risk control. With VIX at 18.65 (FRED, asof 2026-07-20) the current regime is not a stress tape; the frictions are smaller now than they will be at the next breach, which is the argument for writing the rule before you need it.
For readers who want the mechanics of applying bands to a layered portfolio, the companion piece How to Rebalance a 2-Layer Portfolio Without Emotion works through the drift math step by step, and The Arithmetic of a −30% Drawdown covers the recovery math that makes buying weakness worthwhile.
Scoreboard: winner by category
| Category | Winner | Why |
|---|---|---|
| Cost | Tie | Both 0.03% — no differentiator. |
| Realized risk | BND | 6.0% vol and shallower drawdown than VOO's 16.9% / −24.5%. |
| Realized return | VOO | 13.0% vs −0.2% over five years. |
| Role in a rebalance | The pair | Neither wins alone; the low correlation between the legs is the asset. |
FAQ
How wide should my rebalancing band be? The two common conventions are an absolute ±5 percentage points or a relative ±25% around each target weight (Daryanani 2008; Vanguard 2024). Wider bands checked frequently trade less and retain most of the risk-control benefit.
Should I rebalance all at once or in tranches during a drawdown? The band triggers a single instruction, but nothing prevents scaling the trade across a few sessions to reduce timing luck. Doing so is a friction-management choice, not a forecast.
Isn't buying a falling market just catching a falling knife? The band does not claim the fall is over. It claims your equity weight has breached tolerance, so you restore it. Whether the bottom is today or three months out, the rule executes the same trade.
Why hold BND at all when its five-year return is roughly zero? Trailing bond returns understate forward returns after a rate reset; the 4.0% starting yield is the better forward estimate. BND's real job here is low correlation to equities and a source of rebalancing liquidity, not standalone return.
Does rebalancing increase my long-run return? Usually not versus a static all-equity sleeve in a rising market. Its documented benefit is risk control and behavioral discipline — keeping the portfolio inside its intended risk band across cycles.
What this comparison can and can't tell you
The return and drawdown figures cover a single trailing five- and ten-year window that includes one equity drawdown and one rate shock — not multiple independent regimes. Five years is a small sample for drawdown statistics, and neither figure is a stress test against a scenario the data has not yet seen (a simultaneous stock-and-bond selloff, for instance, which 2022 previewed). Treat the numbers as description, not prediction.
Scenarios where each approach fits
A reader in their 30s in a 401(k)-only account can run tight-ish bands with contributions steered to the underweight leg, since tax friction inside the wrapper is zero. A reader in a taxable account should lean on cash-flow rebalancing and wider bands to minimize realized gains. A reader near or in withdrawal may treat BND's higher weight and 4.0% yield as a spending buffer, rebalancing from whichever leg is above band.
Editor's read
If the goal is to act well during a drawdown rather than to be right about its timing, the tolerance band is the more defensible tool — it converts a forecast you cannot make into an arithmetic check you can. The specific VOO/BND weights matter less than committing the band width in writing before the next breach, because the discipline is worth more than the decimal. The one number worth re-examining is BND's flat trailing return, which the current 4.0% starting yield reframes as opportunity rather than damage.
Disclosure: the editor does not disclose individual positions or account values; this article reflects public-market data only.
Methodology. Price, NAV, CAGR, volatility, and drawdown fields from yfinance, pulled 2026-07-22; expense ratio, AUM, and yield from Vanguard issuer fact sheets. Macro figures from FRED (10-year Treasury and VIX asof 2026-07-20; fed funds rate and CPI asof 2026-06-01). Trailing windows are five and ten years to the pull date. Rebalancing-band framework per Daryanani (2008) and Vanguard research (2024).
This article is for educational purposes and does not constitute personalized financial advice. See our full Disclaimer.