The short version
- "Korea," "Taiwan," and "China internet" are marketing labels; under the hood, EWY is largely a memory-chip bet, EWT is a TSMC-centric logic-foundry bet, and KWEB is a platform-regulation bet — three different risks wearing a geography costume.
- Over the trailing five years EWT compounded at 18.0% with the lowest volatility of the three; EWY delivered 16.0% but with a deeper 47.2% drawdown; KWEB lost 12.6% annualized and drew down 68.9% (yfinance, fetched 2026-07-22).
- Bottom line: if you hold one of these expecting "international diversification," measure the look-through concentration first — you may own less diversification than a single US tech ETF.
There is a recurring illusion in single-country ETFs: the ticker names a place, and the investor assumes the fund holds that place broadly. It rarely does. The central question of this article is whether EWY, EWT, and KWEB actually give you exposure to three national economies — or whether they are three narrow, correlated wagers on the same AI-chip supply chain, priced very differently by the market. That distinction matters because it determines what you are diversifying, and whether you are diversifying at all.
The stakes are practical. An allocator who buys all three "for Asia" may believe they are spreading risk across Korea, Taiwan, and China. What the data suggests is closer to owning one cyclical semiconductor factor, one near-monopoly foundry, and one regulated-platform basket — bundled with a large dose of currency and single-name risk. Getting the look-through right changes the position sizing.
Context: what each fund actually holds
All three are cap-weighted index funds, and cap-weighting in a concentrated market produces concentration. The iShares MSCI South Korea ETF (EWY) tracks the MSCI Korea index, where Samsung Electronics and SK Hynix together typically dominate — a memory-semiconductor complex, plus batteries and autos. The iShares MSCI Taiwan ETF (EWT) tracks MSCI Taiwan, where Taiwan Semiconductor Manufacturing (TSMC) alone routinely exceeds a third of the index. The KraneShares CSI China Internet ETF (KWEB) is a different animal entirely: it holds Chinese internet platforms — the Tencent, Alibaba, PDD, Meituan cluster — many via offshore ADR and Hong Kong listings, not the semiconductor supply chain at all.
So two of these funds are chip trades with different chip exposures, and the third is a consumer-internet and regulation trade that people file under the same "China/AI" mental folder. The macro backdrop for the pull date is a 10-year Treasury near 4.6% and the VIX around 18.7 (FRED, asof 2026-07-20) — a moderate-volatility regime, which makes the funds' own realized volatilities, all well above 20%, stand out as concentration risk rather than market-wide stress.
The data
| Metric | EWY | EWT | KWEB |
|---|---|---|---|
| Fund | iShares MSCI South Korea | iShares MSCI Taiwan | KraneShares CSI China Internet |
| Expense ratio | 0.59% | 0.59% | 0.70% |
| AUM | $24.5B | $11.2B | $4.9B |
| Dividend yield | 1.0% | 0.9% | 8.6% |
| Inception | 2000-05-09 | 2000-06-20 | 2013-07-31 |
| 5Y CAGR | 16.0% | 18.0% | -12.6% |
| 10Y CAGR | 14.6% | 19.1% | -0.2% |
| 5Y volatility (ann.) | 32.0% | 23.6% | 47.5% |
| 5Y max drawdown | -47.2% | -38.9% | -68.9% |
Return, volatility, and drawdown figures are computed from yfinance adjusted-close data pulled 2026-07-22; expense ratio, AUM, yield, and inception are from the issuer fact sheets (EWY, EWT, KWEB). One caveat worth stating up front: KWEB's 8.6% reported yield is not a stable coupon — it reflects distributions from a beaten-down NAV and heavy option/holdings turnover, and should not be read like a dividend-growth payout.
Two chip trades that are not the same trade
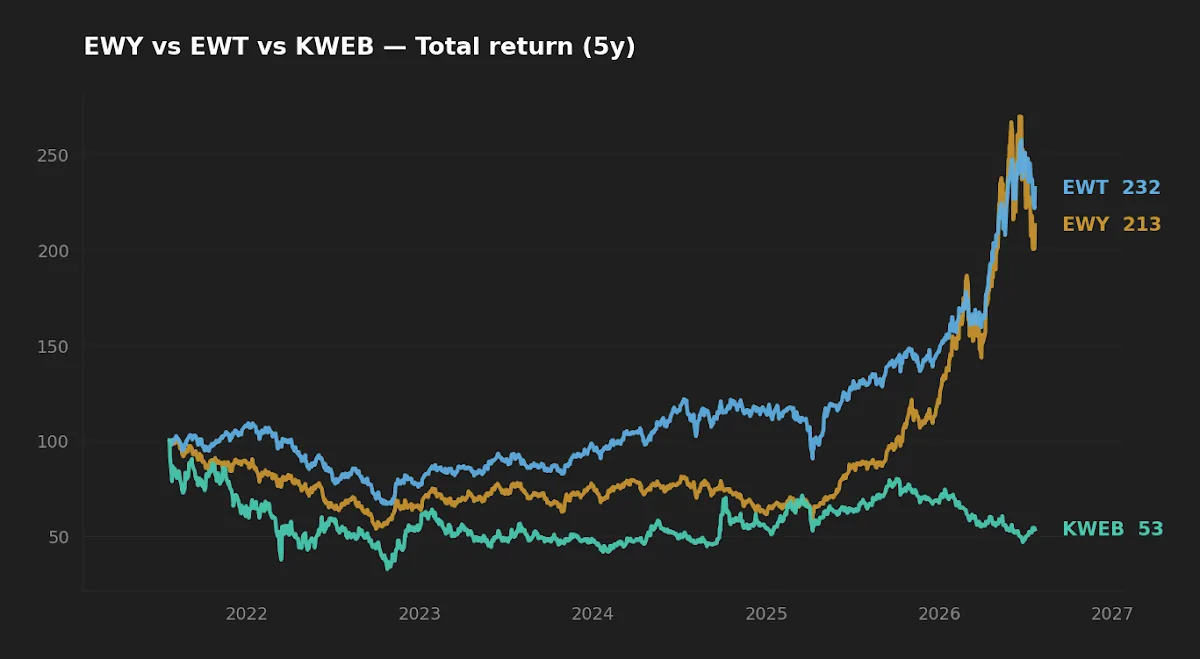
The tempting read is that EWY and EWT are interchangeable "Asian semiconductor" plays. The numbers argue otherwise, and the reason is the kind of chip each index is levered to. Korea's index weight sits heavily in memory — DRAM and NAND — which is a commodity-like, deeply cyclical business: pricing swings with the supply glut cycle, capex is enormous, and margins can go from expansion to contraction in a few quarters. Taiwan's index weight sits in TSMC, a logic foundry with something much closer to pricing power and a structural position at the leading process node.
That difference shows up in realized risk, not just returns. EWT compounded faster (18.0% vs 16.0% over five years) and did so at lower volatility (23.6% vs 32.0%) with a shallower drawdown (-38.9% vs -47.2%). Higher return at lower risk is the signature of a business with more durable economics, not a coincidence of the window. Initially I assumed the gap was mostly a 2026 timing artifact — KOSPI had a rough year while TAIEX held up. But the ten-year figures tell the same story (19.1% vs 14.6% CAGR), which points to structure rather than a single bad quarter for Korea.
When Samsung and SK Hynix are roughly half your "Korea" fund, you do not own Korea — you own the memory-chip cycle with a currency overlay.
This is the same look-through discipline that matters when comparing US technology funds — the question is never the label but the underlying concentration, a point explored in VGT vs XLK and, more generally, in the framework for measuring ETF overlap. A single-country ETF can carry more single-name risk than a broad US sector fund.
KWEB is a different risk entirely
KWEB does not belong in the chip conversation on fundamentals, even though it gets grouped there by geography. It is a basket of Chinese internet platforms, and its five-year record — a 12.6% annualized loss and a 68.9% peak-to-trough drawdown — is dominated by the 2021–2022 regulatory reset and the offshore-listing (VIE/ADR) risk premium that never fully un-priced. Its 47.5% annualized volatility is roughly double EWT's. The ten-year CAGR of essentially zero (-0.2%) is the more sobering number: a decade of ownership with no compounding to show for it.
None of that makes KWEB uninvestable; deep-value, mean-reversion, and policy-turn theses all have honest arguments. But it means the fund is a wager on Chinese platform regulation and geopolitical de-risking, not on the AI-chip supply chain. Bundling it with EWY and EWT because all three are "Asia tech" mixes a semiconductor cycle bet with a governance-and-policy bet. Those risks are not the same, and they will not diversify each other in the way the label implies.
Realized risk and the drawdown record
Drawdown duration and depth are where single-country concentration stops being abstract. The chart below plots the rolling drawdown for each fund over the five-year window.
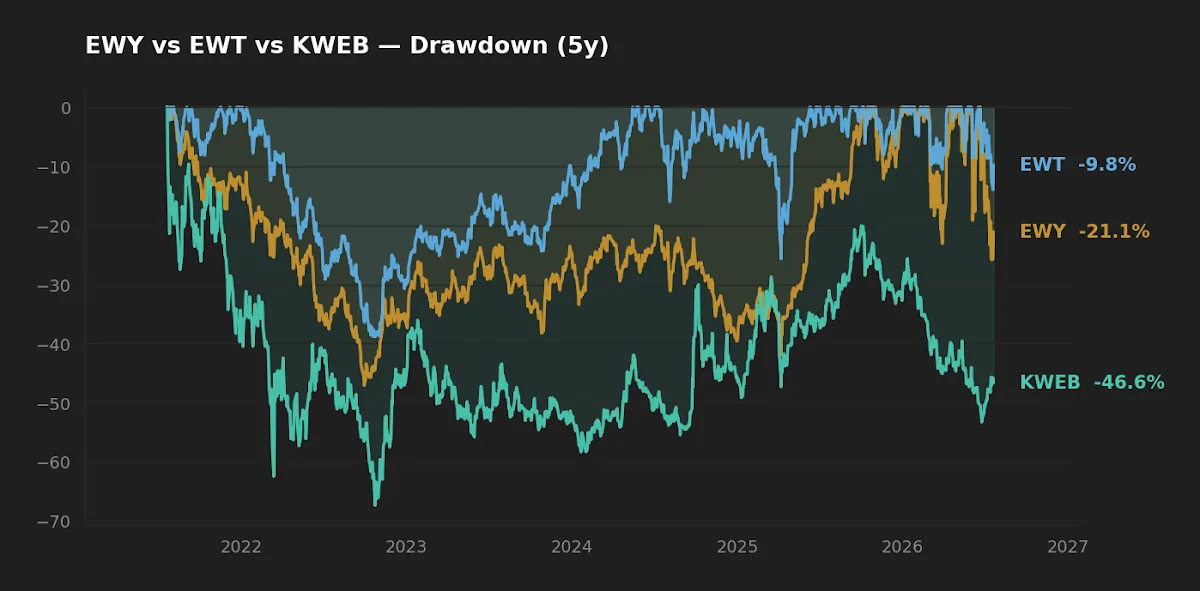
The ranking is unambiguous: KWEB (-68.9%) drew down far deeper and stayed underwater longer than EWY (-47.2%), which in turn was worse than EWT (-38.9%). For a long-horizon holder, the behavioral cost of a two-thirds drawdown is easy to underestimate in a spreadsheet and very hard to sit through in real time. The point is not that risk should be avoided — it is that concentration risk should be sized deliberately, and a fund that can lose two-thirds of its value belongs in a satellite sleeve, not the core, unless the entire thesis of the portfolio is built around it.
What the fees and structure tell you
All three are expensive relative to broad-market index funds: 0.59% for the iShares pair and 0.70% for KWEB. That is the price of narrow, single-country access, and over decades it compounds — a point worth weighing against how much distinct exposure you are actually buying. EWY's $24.5B AUM gives it the tightest liquidity and spreads; KWEB's $4.9B is still ample but its underlying ADR/HK plumbing adds a layer of structural risk that a US large-cap fund does not carry. For an investor whose core already holds a global index fund such as the one discussed in the three-fund portfolio, some of this exposure is already owned indirectly — buying these funds on top of it may concentrate rather than diversify.
| Category | Winner | Why |
|---|---|---|
| Cost | EWY / EWT (tie) | 0.59% vs KWEB's 0.70% |
| Realized risk (5Y) | EWT | Lowest volatility (23.6%) and shallowest drawdown (-38.9%) |
| Realized return (5Y & 10Y) | EWT | 18.0% / 19.1% CAGR, ahead on both windows |
| Suitability as a diversifier | None cleanly | All three carry heavy single-name or single-theme concentration |
FAQ
Are EWY and EWT basically the same "chip ETF"? No. EWY is weighted toward memory semiconductors (Samsung, SK Hynix), a cyclical commodity-like business; EWT is weighted toward TSMC, a logic foundry with more durable economics. That difference showed up as EWT's higher return at lower volatility over both the 5- and 10-year windows (yfinance, 2026-07-22).
Why did KWEB do so badly? Its five-year -12.6% CAGR and -68.9% drawdown reflect China's 2021–2022 platform-regulation reset and a persistent offshore-listing risk premium, not the semiconductor cycle. It is a different risk from the two chip funds.
Is KWEB's 8.6% yield safe income? Treat it with caution. The figure comes from distributions on a depressed NAV and high turnover, not a stable, growing dividend. Against a 10-year Treasury near 4.6% (FRED, asof 2026-07-20), a headline yield that high signals risk, not a free lunch.
Do these funds hedge currency? No — all three carry unhedged currency exposure (KRW, TWD, and CNY/HKD respectively). Part of the return and volatility you see is exchange-rate movement, not just equity performance.
Can I use these for international diversification? Only carefully. Because each is dominated by a handful of names or one theme, a small position can add more concentration than diversification. Measure the look-through overlap with what you already hold before sizing.
What this comparison can and can't tell you
The return and risk figures rest on a five- and ten-year window that includes one major China regulatory shock and a strong global semiconductor run — a single, favorable-to-Taiwan regime. It does not capture a full memory down-cycle bottoming and recovering, nor a China policy re-rating, either of which could reorder the results. These are point-in-time snapshots (NAV, AUM, and yield as of the pull date); index weights drift, and a fund that is TSMC-heavy today was less so a decade ago. Nothing here is a forecast.
Scenarios where each fits
A reader who wants targeted exposure to leading-edge logic manufacturing, and accepts single-name TSMC risk, may find EWT the cleanest expression. A reader with a specific view on the memory-chip up-cycle might prefer EWY, understanding it is a cyclical, higher-volatility position. A reader with a deep-value, contrarian thesis on Chinese platforms — and the tolerance for a two-thirds drawdown — is the only profile for whom KWEB is a considered choice rather than an accidental one. For a broadly diversified long-horizon investor with no specific thesis, none of the three is a natural core holding.
Editor's read
If forced to pick one, the editor leans toward EWT — not as a prediction, but because a logic foundry with pricing power has produced higher realized return at lower realized volatility across two windows, which is the profile you want when concentration is unavoidable. The larger point stands above any single ticker: all three are concentrated bets dressed as country funds, and the disciplined move is to measure the look-through before sizing, not after. Faithfulness in the small things — knowing exactly what you own — does more work here than any allocation call.
Holdings disclosure: the editor does not hold EWY, EWT, or KWEB at the time of writing.
Methodology: return, volatility, and drawdown metrics computed from yfinance adjusted-close price data pulled 2026-07-22, five- and ten-year trailing windows; expense ratio, AUM, dividend yield, and inception from issuer fact sheets (iShares, KraneShares); macro figures from FRED (10-year Treasury and VIX asof 2026-07-20, Fed funds and CPI asof 2026-06-01).
This article is for educational purposes and does not constitute personalized financial advice. See our Disclaimer.