
Photo by Anatolii Nesterov on Unsplash
The short version
- Cap-weighting quietly routes the same handful of mega-cap AI and semiconductor names into QQQ, VOO, and VTI — so "broad" and "concentrated" have become a spectrum, not a binary.
- Over five years QQQ compounded fastest (15.0% CAGR) but fell hardest (−35.1% max drawdown); VOO and VTI landed close to each other on both return and risk despite VTI holding thousands more stocks.
- Bottom line: the look-through factor bet matters more than the fund label. Measuring it is a skill worth having before the next regime, not after.
A reader who owns VOO or VTI usually files the position under "diversified." A reader who owns QQQ knows they are making a bet. The uncomfortable finding of the last few years is that the gap between those two mental categories has narrowed — and most holders never opted into the change. The central question here is simple: how much semiconductor and AI exposure are you actually carrying inside a fund you think of as broad, and how would you measure it if you wanted to know?
This matters because the 2026 selloff did not respect fund labels. When a concentrated cohort of chip and platform names re-rated, holders who felt diversified discovered they were long a single factor. Understanding look-through exposure — the economic weight beneath the ticker — is the difference between owning a portfolio and owning a story about a portfolio.
A 90-second orientation
All three funds are market-capitalization weighted, which means each holding's weight rises with its market value. QQQ tracks the Nasdaq-100, a rules-based index of the largest non-financial companies listed on the Nasdaq — structurally tilted toward technology. VOO tracks the S&P 500, the large-cap core of the U.S. market. VTI tracks a total-market index of roughly the entire investable U.S. equity universe, several thousand names deep.
On paper these look like three rungs on a diversification ladder: most concentrated, middle, broadest. The mechanism that undermines that intuition is cap-weighting itself. When a small group of companies grows to dominate total market value, they dominate every cap-weighted index that contains them — including the "total market" one. The ladder compresses at the top.
What the funds hold, and what they cost
| Metric | QQQ | VOO | VTI |
|---|---|---|---|
| Name | Invesco QQQ Trust | Vanguard S&P 500 ETF | Vanguard Total Stock Market ETF |
| Index | Nasdaq-100 | S&P 500 | CRSP US Total Market |
| Expense ratio | 0.18% | 0.03% | 0.03% |
| AUM | $490.1B | $1,670.9B | $2,297.9B |
| Dividend yield | 0.4% | 1.1% | 1.1% |
| 5Y CAGR | 15.0% | 13.0% | 12.0% |
| 10Y CAGR | 21.1% | 15.2% | 14.7% |
| 5Y volatility (annualized) | 22.8% | 16.9% | 17.5% |
| 5Y max drawdown | −35.1% | −24.5% | −25.4% |
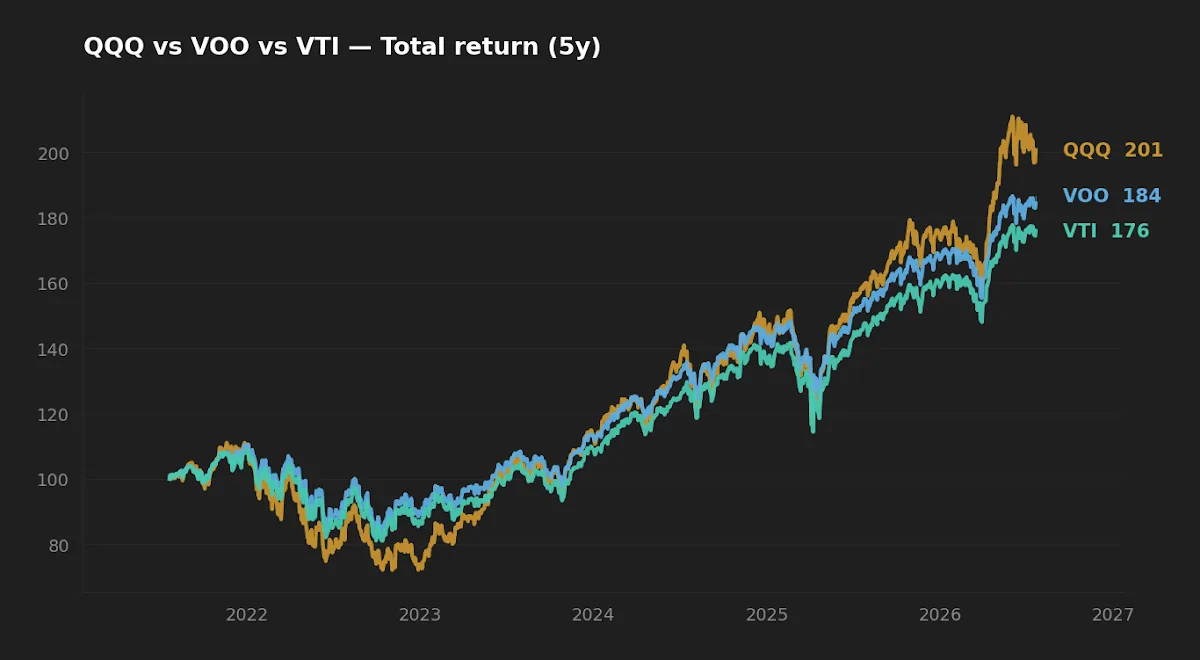
Return, volatility, and drawdown figures are computed from adjusted daily closes via yfinance over the five- and ten-year windows ending 2026-07-22. Expense ratios, yields, and AUM are from issuer materials: Invesco QQQ, Vanguard VOO, and Vanguard VTI. The five-year normalized total-return paths below start every fund at the same base so the shape of the compounding — and the depth of the shared decline — is comparable.
The concentration nobody opted into
Start with the mechanism rather than the headline number. In a cap-weighted index, the marginal dollar of new investment flows to holdings in proportion to their existing size. That is a momentum-like property baked into the structure: winners get heavier, and the index's factor exposure drifts toward whatever the largest companies happen to be. Over the past decade the largest companies have been platform and semiconductor businesses whose economics are increasingly tied to AI compute demand.
The result is that the same names sit at the top of all three funds — the difference is how much the rest of each portfolio dilutes them. QQQ, drawing from a narrower, tech-tilted universe, dilutes them least. VOO dilutes more across 500 large caps. VTI dilutes across the full market. But dilution is not the same as neutralization. Because the tail holdings are individually tiny under cap-weighting, they cannot meaningfully offset a top that has grown this heavy. The concentration is a top-of-book phenomenon, and cap-weighting is precisely the rule that lets the top of the book run.
This is the same dynamic explored in how market-cap weighting translates a single stock into portfolio exposure: one company's weight in your fund is a mechanical output of its market value, not a decision you made. Scale it up from one stock to a correlated cohort of AI and chip names, and you have a factor bet that no line in the fund's name discloses.
Measuring true look-through exposure
If the sector label on a fund fact sheet were sufficient, none of this would need saying. It is not, for two reasons. First, sector taxonomies split economically similar businesses across buckets — a chip designer, a foundry-exposed hardware name, and a hyperscaler that buys accelerators may sit in different sectors while sharing one underlying driver. Second, revenue exposure is not the same as listing classification. A "software" company deriving a growing share of value from AI infrastructure carries semiconductor-adjacent risk that a sector screen misses.
A more honest look-through is a two-step calculation. Take each holding's weight in the fund, then multiply by an estimate of that holding's own exposure to the factor you care about — here, AI/semiconductor economics — and sum across holdings. The output is not a precise constant; it is a range that depends on how you define the factor. That ambiguity is the point. The exercise forces you to state your assumptions instead of trusting a label, and it reveals that "diversified" and "concentrated" are endpoints of a continuous look-through spectrum rather than two boxes. Readers building this muscle will find the mechanics in measuring redundancy in a long-term core and in the framework for measuring ETF overlap.
Adding thousands of small-cap names to a cap-weighted fund changes the brochure far more than it changes the risk — because the tail you added is, by construction, a rounding error against the top you already owned.
What the realized numbers show — and where the risk actually lived
Over the trailing decade QQQ compounded at 21.1% annually against VOO's 15.2% and VTI's 14.7%. That is a large gap, and it is real. It is also the reward side of a factor bet that showed its cost on the downside: QQQ's five-year annualized volatility of 22.8% and max drawdown of −35.1% both sit well above VOO (16.9%, −24.5%) and VTI (17.5%, −25.4%). Nothing here is free; the higher return came with a materially deeper trough and a longer road back.
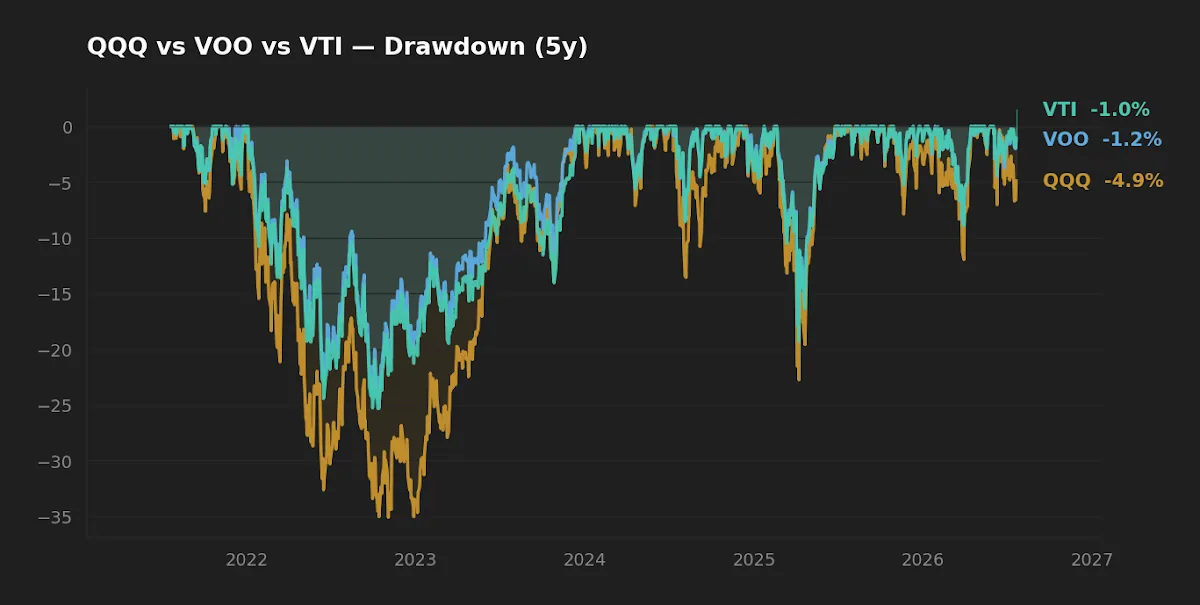
The drawdown chart is where the concentration argument stops being theoretical. Note how the three lines move together on the way down — the decline was not idiosyncratic to the Nasdaq-100. It was driven by a re-rating of names that all three funds share at the top. QQQ simply carried more of them, so it fell further. Initially I expected VTI's breadth to cushion its trough noticeably versus VOO. The realized numbers did not support that: VTI's drawdown was marginally deeper than VOO's, not shallower. The small-cap tail did not protect on the day it was supposed to, because the shock originated in the mega-cap names the tail could not outweigh.
The diversification illusion, and the opportunity-cost lens
That last observation is the non-obvious takeaway. VTI holds several thousand more companies than VOO, yet its five-year risk and return profile is barely distinguishable — slightly lower return, slightly higher drawdown. Cap-weighting is why: the incremental names are individually too small to shift the portfolio's behavior, so the "total market" fund inherits nearly the same top-heavy factor exposure as the S&P 500 core. Breadth in the holdings count is not breadth in the risk. This is consistent with the overlap analysis in what the VOO-versus-VTI difference actually costs over decades.
Cost and yield frame the trade differently. QQQ's 0.18% expense ratio is six times VOO's and VTI's 0.03% — a 0.15% annual gap that compounds against the higher-return fund every year regardless of performance. And QQQ's 0.4% dividend yield sits far below VOO and VTI's 1.1%, which matters more in the current rate regime: with the 10-year Treasury near 4.6% and the fed funds rate at 3.63% (FRED, asof 2026-07-20 and 2026-06-01), the opportunity cost of a near-zero-yield equity sleeve is more visible than it was in a zero-rate world. With the VIX around 18.65 (FRED, asof 2026-07-20) — an unremarkable volatility regime — none of these funds is pricing in stress today. The look-through exposure is a slow-building condition, not a flashing alarm, which is exactly why it goes unmeasured.
Scoreboard: winner by category
| Category | Edge | Why |
|---|---|---|
| Cost | VOO / VTI | 0.03% vs QQQ's 0.18%; 0.15% annual drag compounds. |
| Realized return (10Y) | QQQ | 21.1% CAGR vs 15.2% / 14.7% — the factor bet paid. |
| Realized risk | VOO | Lowest volatility (16.9%) and shallowest drawdown (−24.5%). |
| Suitability as a core | VOO / VTI | Broader base, lower concentration, higher yield for a long-horizon core. |
FAQ
Is QQQ a technology fund? Not by mandate — the Nasdaq-100 is a rules-based index of large non-financial Nasdaq listings. But because those listings skew toward technology and because cap-weighting concentrates the top, QQQ behaves like a tech-tilted fund in practice. The behavior, not the charter, is what shows up in your drawdown.
Does owning VTI mean I'm truly diversified? Diversified by holdings count, yes. Diversified by risk, less than the number implies. The realized five-year data shows VTI tracking VOO closely on both return and drawdown despite thousands of extra names, because cap-weighting keeps the mega-cap top dominant.
Can I just check the fund's sector weights to know my chip exposure? Sector weights are a starting point, not an answer. They miss cross-sector economic links and revenue-level exposure. A proper look-through multiplies each holding's weight by its own factor exposure and sums — a range, not a single tidy percentage.
Why did QQQ fall so much more in the 2026 drawdown? It carried the largest weight in the concentrated cohort that re-rated. The decline was shared across all three funds — the drawdown chart shows the lines moving together — but QQQ held more of the affected names, so its trough was deeper at −35.1%.
Is the higher expense ratio on QQQ worth it? That is a personal trade-off, not a universal answer. QQQ's 0.15% annual cost premium is a certain, compounding drag; its historical return advantage is real but regime-dependent and comes with materially higher drawdown risk. The cost is knowable in advance; the return is not.
What this comparison can and can't tell you
The return, volatility, and drawdown figures cover five- and ten-year windows that fall almost entirely within one broad regime: a long expansion punctuated by sharp but recovering selloffs. They do not include a prolonged bear market or a sustained high-rate decade, and they cannot tell you how concentration behaves through a multi-year unwind. Past factor leadership is not a forecast. This analysis also stops at fund-level statistics; a precise instrument-level look-through of every holding's AI/semiconductor revenue is beyond public daily price data and would carry its own estimation error. Treat the concentration finding as directional and structural, not as a calibrated exposure number.
Scenarios where each fund fits
A reader in their 30s, 401(k)-only, long horizon, seeking one broad core holding. VOO or VTI covers the large-cap or total-market base at 0.03% with lower concentration than QQQ. The choice between them is second-order, as the overlap data shows.
A reader who explicitly wants a growth/AI factor tilt and can tolerate a deeper trough. QQQ expresses that tilt directly — provided the tilt is a deliberate decision sized on purpose, not an accident inherited from a "diversified" label.
A reader who already owns a broad core and is considering adding QQQ. The relevant question is marginal, not standalone: how much of QQQ's top already sits inside the VOO or VTI you hold? Layering can concentrate the same factor twice, which is the overlap problem in disguise.
Editor's read
For a long-horizon core, the editor leans toward the broad, low-cost base (VOO or VTI) over QQQ — not because QQQ's decade of outperformance was illusory, but because the concentration that produced it is a factor bet best sized deliberately as a satellite rather than smuggled into a position labeled "diversified." The 0.15% fee gap is a certain drag; the return premium is regime-dependent and paid for with a −35.1% drawdown. The more durable takeaway is the discipline itself: measure the look-through before you need to, so the next selloff is something you understood in advance rather than discovered inside your own account.
Editor's holdings disclosure: the editor holds broad-market index exposure of the kind discussed here; specific fund-level positions are not disclosed, and this is not a recommendation of any single fund.
Methodology: return, volatility, and drawdown computed from adjusted daily closes via yfinance over the five- and ten-year windows ending 2026-07-22. Expense ratio, AUM, and dividend yield from issuer fact sheets (Invesco, Vanguard). Macro references from FRED as of the dates cited. Charts illustrate the same computed series.
This article is for educational purposes and does not constitute personalized financial advice. See our Disclaimer.