
Photo by Fontis AG on Unsplash
The short version
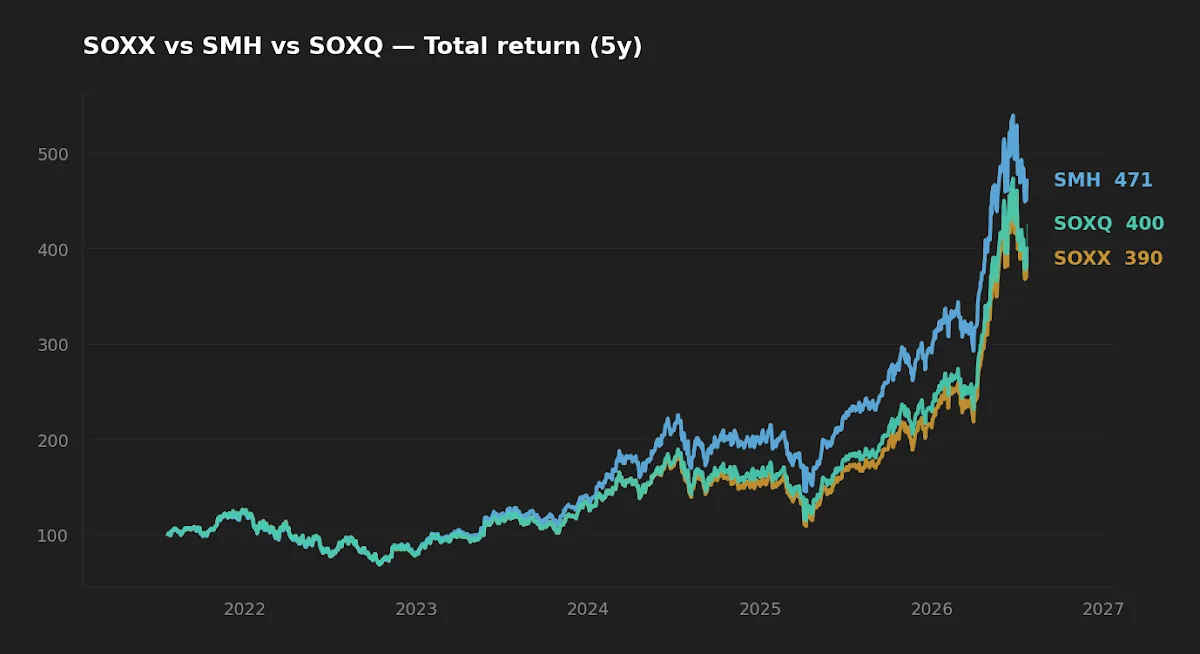
- The three funds look nearly identical on realized volatility and five-year max drawdown, but SMH's 5Y CAGR beat SOXX by roughly 4.9 percentage points a year — a gap driven by index methodology, not luck.
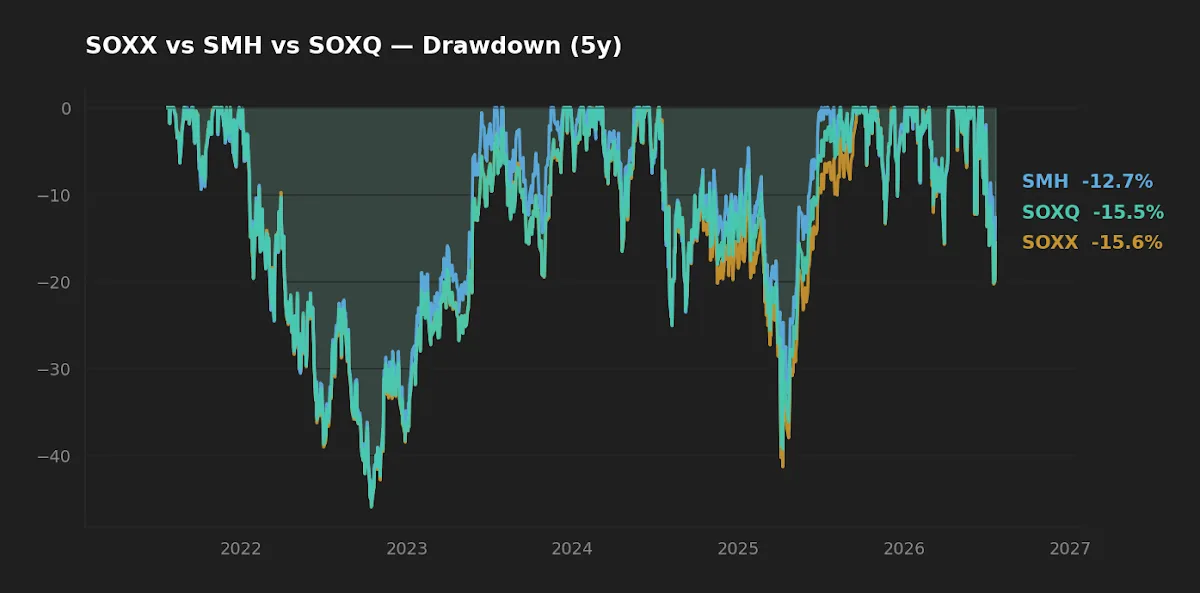
- In the June–July 2026 selloff the most concentrated fund (SMH) fell least (−12.7% vs SOXX's −15.6%), because the pain originated in equipment and second-tier names rather than the megacap core it overweights.
- Bottom line: SOXQ wins on fee, SMH on realized return and recent resilience, SOXX on the longest live record — and none of the three belongs anywhere near a portfolio core.
The June–July 2026 semiconductor selloff did what every prior chip drawdown has done: it made three ETFs that market themselves as interchangeable behave differently enough to matter. From their June peaks, SOXX fell about 15.6% and SMH about 12.7% (price data through 2026-07-22). That 2.9-point spread is not noise. It is the visible edge of a construction difference that also explains why one of these funds has compounded materially faster than the others over the past five years. The question worth asking is not which chip ETF is "best," but which construction you are actually buying — and whether a single-sector bet of this volatility has any claim on long-horizon capital at all.
Context: three funds, three indices, one sector
All three track the US semiconductor complex, but through different rulebooks. SOXX (iShares) tracks the NYSE Semiconductor Index, roughly 30 US-listed names under a capped-weight scheme. SMH (VanEck) tracks the MarketVector US Listed Semiconductor 25 Index — just 25 holdings, and critically it admits Taiwan Semiconductor's US-listed ADR, giving it foundry exposure the others carry only thinly. SOXQ (Invesco) tracks the PHLX Semiconductor Sector Index (the original "SOX"), about 30 names on a modified market-cap weighting, and it does so at the lowest fee of the three.
The sector itself sits at the intersection of the AI capital-expenditure cycle and a still-restrictive rate regime — the 10-year Treasury at 4.6% and CPI running 3.7% year over year (FRED, asof 2026-06-01/2026-07-20). Semiconductors are long-duration equity: their valuations lean heavily on cash flows years out, which is precisely why they whip around when the discount rate or the AI narrative twitches. A VIX of 18.65 (FRED, asof 2026-07-20) tells you the broad market was calm through this selloff. The chip drawdown was sector-specific, not systemic — a useful detail, because it isolates construction as the variable.
The data
| Metric | SOXX | SMH | SOXQ |
|---|---|---|---|
| Issuer / index | iShares / NYSE Semi | VanEck / MVIS 25 | Invesco / PHLX SOX |
| Expense ratio | 0.34% | 0.35% | 0.19% |
| AUM | $47.8B | $77.2B | $2.8B |
| Inception | 2001-07-10 | 2011-12-20 | 2021-06-11 |
| Dividend yield | 0.2% | 0.2% | 0.3% |
| 5Y CAGR | 31.1% | 36.0% | 31.5% |
| 10Y CAGR | 34.0% | 35.9% | n/a (2021 launch) |
| 5Y volatility (ann.) | 37.9% | 36.2% | 37.9% |
| 5Y max drawdown | −45.8% | −45.3% | −46.0% |
Return and risk figures are computed from adjusted daily prices via yfinance, five-year window ending 2026-07-22. Expense ratio, AUM, inception and yield are from each issuer's fact sheet: SOXX, SMH, SOXQ.
Why SMH pulled ahead — and what the return gap actually costs you
SMH's 5Y CAGR of 36.0% against SOXX's 31.1% is a 4.9-point annual gap. Compounded, that is not a rounding error: over a decade it is the difference between roughly 3.3x and 2.5x on a dollar, before tax. The mechanism is concentration. SMH holds 25 names and lets its largest positions — the AI-cycle megacaps plus TSMC's foundry exposure — run to heavier weights than the capped NYSE index underlying SOXX permits. In an era when a handful of accelerator and foundry names captured the bulk of sector cash flow, the fund that concentrated into them captured the bulk of the return.
Here is the discipline point. That 4.9-point return gap dwarfs the 0.16-point fee gap between SOXQ (0.19%) and SMH (0.35%). Fee minimization is the right default reflex — basis points compound, and in a broad-index core the cheapest share class usually wins on arithmetic alone. But in a concentrated sector sleeve, methodology overwhelms fee. Choosing SOXQ to save 16 basis points, and getting a different index, is optimizing the small number while ignoring the large one. The honest caveat: this is a realized, single-regime result. The same concentration that won the last five years is a bet that the same names keep leading. Nothing in the data guarantees that.
In a broad-index core, fee is the variable that matters most. In a concentrated sector sleeve, it is almost the only one that doesn't.
Realized risk: why the most concentrated fund fell least
Over five years all three funds carry nearly identical realized risk — volatility of 36–38% and a max drawdown clustered tightly between −45.3% and −46.0%. On paper they are the same risk asset. Yet in the June–July 2026 selloff SMH, the most concentrated of the three, drew down the least (−12.7% vs SOXX −15.6%). That runs against the intuition that concentration is monotonically riskier.
The resolution is where the drawdown originated. This selloff was led by semiconductor equipment names and second-tier designers — positions that carry meaningful weight in the broader 30-stock indices behind SOXX and SOXQ, but less in SMH's top-heavy 25. When the pain concentrates outside a fund's largest holdings, a top-heavy fund is cushioned; when it concentrates inside them, the same fund is punished harder. Concentration is not a risk level. It is a bet on where future stress lands, and the sign of that bet flips depending on the shock. The five-year max-drawdown figures, nearly identical across all three, are the reminder that over a full cycle these distinctions wash out — a single quarter is not a risk model.
Implementation friction: AUM, spreads, and the concentration cap
SOXQ is the cheapest and, at $2.8B in AUM, the smallest — roughly 4% the size of SMH's $77.2B. For a buy-and-hold holder that scale gap is mostly benign, but it is not nothing: smaller funds carry wider bid-ask spreads and modestly higher closure risk, both of which quietly erode the 16-basis-point fee advantage that drew you in. SMH and SOXX, at tens of billions apiece, trade with penny spreads that make the fee sticker the honest cost.
There is also a structural friction unique to SMH's approach. A 25-stock fund that lets winners run bumps against index concentration limits — regulatory caps on how much any single name can represent. When a top holding surges, the index must trim it at reconstitution, mechanically selling strength. That is a subtle, recurring drag on the very concentration that produced the outperformance, and it is invisible in a headline expense ratio. If you compare these to a broad equity holding, the framing in our note on what risk actually means for long-term ETF investors applies directly: volatility you can sit through is survivable; a permanent commitment to a single sector at the wrong weight is not.
Where a chip ETF sits — and where it doesn't
None of these three is a core holding. A 46% max drawdown and 37% annualized volatility describe a satellite position — a deliberate, sized tilt on top of a diversified base, not a foundation. The literature on portfolio construction is consistent on this: single-sector concentration adds idiosyncratic risk that broad-market diversification is specifically designed to remove. If a reader wants semiconductor exposure, the disciplined version is a small, band-managed satellite whose size is chosen so that a −46% drawdown in the sleeve is a survivable dent in the total portfolio, not a portfolio-defining event. That sizing logic is the same one behind our write-up on whether leveraged ETFs can sit in a long-term portfolio — the instrument changes, the drawdown-math discipline does not.
A chip ETF is a satellite you size so that its worst quarter is a footnote, not a headline.
Scoreboard
| Category | Winner | Why |
|---|---|---|
| Cost | SOXQ | 0.19% vs 0.34–0.35% |
| Realized return (5Y) | SMH | 36.0% CAGR; concentration captured the AI cycle |
| Realized risk / recent resilience | SMH (narrowly) | Shallowest 2026 drawdown; 5Y risk near-identical across all three |
| Track record / liquidity | SOXX | Live since 2001; deep AUM, tight spreads |
| Suitability as core | None | All are satellite-grade risk assets |
FAQ
Is SMH better than SOXX just because it returned more? Over the trailing five years SMH's 36.0% CAGR beat SOXX's 31.1%, but that is a realized, single-regime result driven by heavier concentration in the AI-cycle leaders. It is a bet that the same names keep leading. The data cannot tell you whether that holds.
Why is SOXQ so much cheaper? SOXQ charges 0.19% versus 0.34–0.35% for the others — a positioning choice by Invesco as the low-cost challenger. The trade-off is a much smaller fund ($2.8B AUM) with wider spreads and higher closure risk, and a different underlying index (the PHLX SOX).
Do all three hold the same stocks? Largely overlapping but not identical. SMH holds only 25 names and admits Taiwan Semiconductor's ADR at meaningful weight; SOXX and SOXQ hold roughly 30 names under different weighting caps. Those differences drove both the return gap and the different 2026 drawdowns.
Should a semiconductor ETF be a core holding? The realized risk profile — roughly 37% annualized volatility and a −46% five-year max drawdown — is satellite-grade. Standard portfolio construction treats single-sector funds as sized tilts on a diversified base, not as a foundation.
How were these numbers calculated? Return, volatility and drawdown are computed from adjusted daily closes via yfinance over a five-year window ending 2026-07-22. Fees, AUM, inception and yield come from each issuer's fact sheet. Macro context is from FRED as of mid-2026.
Key takeaways
- SMH's five-year outperformance (36.0% vs SOXX's 31.1% CAGR) came from index concentration, and that 4.9-point gap dwarfs the 0.16-point fee gap — methodology, not fee, dominates in a sector sleeve.
- The three funds carry nearly identical five-year risk (37% volatility, ~−46% max drawdown); their differences show up only in specific selloffs.
- Concentration is not monotonically riskier — SMH fell least in July 2026 because the shock landed outside its largest holdings.
- SOXQ's fee edge is partly offset by small-AUM spreads and closure risk; SOXX offers the longest live record and deepest liquidity.
- All three are satellite instruments; the disciplined use is a small, band-sized tilt on a diversified core, never the core itself.
Editor's read
If the goal is deliberate semiconductor exposure as a small satellite, the editor leans toward SMH for its liquidity and its cleaner expression of the foundry-plus-accelerator thesis that has defined the sector — while noting plainly that its edge is a concentration bet that has only been tested in one favorable regime. SOXQ is the more interesting choice for a cost-sensitive holder who wants the classic SOX index and can tolerate a smaller fund. But the more important decision is the sizing, not the ticker: at these drawdown magnitudes, the position weight matters far more than which of the three you pick.
The editor does not hold any of the three funds discussed at the time of writing.
Methodology. Price-derived metrics (CAGR, annualized volatility, max drawdown) computed from adjusted daily closes via yfinance over a trailing five-year window ending 2026-07-22. Expense ratio, AUM, inception date and dividend yield from iShares, VanEck and Invesco fact sheets. Macro figures (10Y Treasury 4.6%, fed funds 3.63%, VIX 18.65, CPI 3.7% YoY) from FRED, as of 2026-06-01 to 2026-07-20. June–July 2026 selloff figures computed from the same price series.
This article is for educational purposes and does not constitute personalized financial advice. See the full Disclaimer.