
Photo by Marcus Reubenstein on Unsplash
The short version
- From their June 2026 peaks, the two large U.S. semiconductor ETFs fell hard — SOXX −15.6% and SMH −12.7% — but their long-term uptrends stayed intact, which reads as a momentum unwind rather than a fundamental break.
- The striking data point: Korea's broad national equity index (KOSPI, −22.2%) dropped more than the concentrated U.S. chip sector itself, because cap-weighted Korean equity had quietly become a memory-chip bet in disguise.
- Bottom line: the lesson is concentration and crowding, not timing. Know the factor exposure hiding under a "diversified" label before the next unwind, not after.
The most crowded trade of the cycle cracked in the summer of 2026, and the way it cracked is more instructive than the fact that it did. Semiconductors — the purest public-market expression of the AI capital-spending boom — sold off sharply from late-June highs. The central question worth sitting with is not whether chips will recover, but why a single national stock market fell harder than the very sector that supposedly caused the pain. That asymmetry is the whole story.
Context: what actually moved
Measured from their 2026 peaks through 22 July (adjusted daily closes, yfinance), the drawdowns line up in a revealing order. The iShares Semiconductor ETF (SOXX), which tracks a PHLX-style U.S. chip index, fell −15.6% from its 22 June high. The larger VanEck Semiconductor ETF (SMH) fell −12.7% over the same window. The two most-watched single names held up better than the leveraged and thematic expressions: Nvidia (NVDA) was −12.0% from its 14 May peak, and TSMC's ADR (TSM) −11.1% from 30 June.
Then the outliers. Taiwan's broad TAIEX index — chip-heavy, but home to a wider industrial base — fell only −5.8%. Korea's KOSPI fell −22.2%. A whole national market dropped more than the concentrated U.S. semiconductor indices. When a "diversified" country index behaves like a leveraged sector fund, that tells you the diversification was nominal, not real.
The macro backdrop was not a crisis. The VIX sat at 18.65 and the 10-year Treasury at 4.6% (FRED, as of 2026-07-20), with CPI running 3.7% year-over-year (FRED, June 2026). This was not a liquidity event or a rate shock. It was a crowded factor mean-reverting under its own weight.
The two ETFs at the center of the U.S. move
SOXX and SMH are the vehicles most U.S. investors actually held into this drawdown, so their characteristics matter. The numbers below are five- and ten-year annualized figures computed from adjusted closes (yfinance, fetched 2026-07-22); expense ratio and AUM are from the issuer fact sheets.
| Metric | SOXX (iShares) | SMH (VanEck) |
|---|---|---|
| Expense ratio | 0.34% | 0.35% |
| AUM | $47.8B | $77.2B |
| Inception | 2001-07-10 | 2011-12-20 |
| Distribution yield | 0.2% | 0.2% |
| 5Y CAGR | 31.1% | 36.0% |
| 10Y CAGR | 34.0% | 35.9% |
| 5Y annualized volatility | 37.9% | 36.2% |
| 5Y max drawdown | −45.8% | −45.3% |
Fact sheets: iShares SOXX and VanEck SMH. The fee gap between them is a single basis point (0.01%) — immaterial. The more interesting divergence is composition: SMH runs a more concentrated, top-heavy book weighted toward the largest chipmakers, while SOXX historically spread across a broader roster of U.S.-listed names. That concentration helps explain why SMH's realized 5Y CAGR (36.0%) outpaced SOXX's (31.1%) through the boom — and why the same concentration cuts both ways when the leaders roll over.
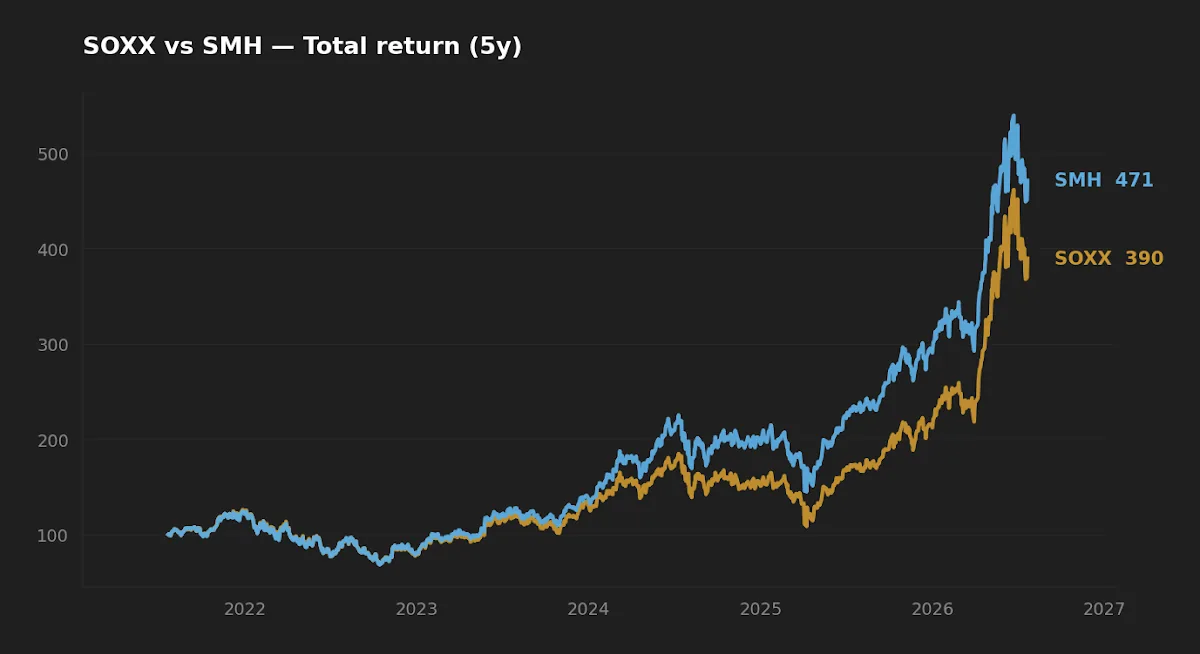
Why this looks like a momentum unwind, not a collapse
The distinction matters for how a long-horizon investor should respond. A fundamental collapse breaks the trend: prices fall through long-term moving averages and stay there because the earnings thesis has changed. A momentum unwind is different — a stretched trend snaps back violently toward its mean while the underlying uptrend remains intact. Through 22 July, the broad chip ETFs had given back a sharp move but were still trading above their 200-day averages. The trend bent; it did not break.
This is the texture the academic literature on momentum would predict. Barroso and Santa-Clara (2015), "Momentum Has Its Moments," documented that momentum's worst episodes are not slow bleeds but sudden, high-volatility crashes — the strategy's returns are negatively skewed and cluster in exactly the panicked, fast-reversal conditions we saw here. A crowded momentum trade does not deflate gently. Everyone reaches for the same exit at once, and the reach itself deepens the move.
When a country's broad national index falls harder than the concentrated sector that caused the selloff, the diversification was nominal, not real.
Realized risk: what the drawdown record actually shows
The drawdown chart below places this episode against the five-year history. The −15.6% peak-to-date fall in SOXX is real, but it sits well inside a five-year maximum drawdown of −45.8% (SMH: −45.3%). An investor who held these funds through the prior cycle already lived through a decline roughly three times larger. Semiconductors carry ~37% annualized volatility — more than double a broad market index. A −20% move in this sleeve is not a tail event; it is the cost of admission, and position sizing should assume it will recur.
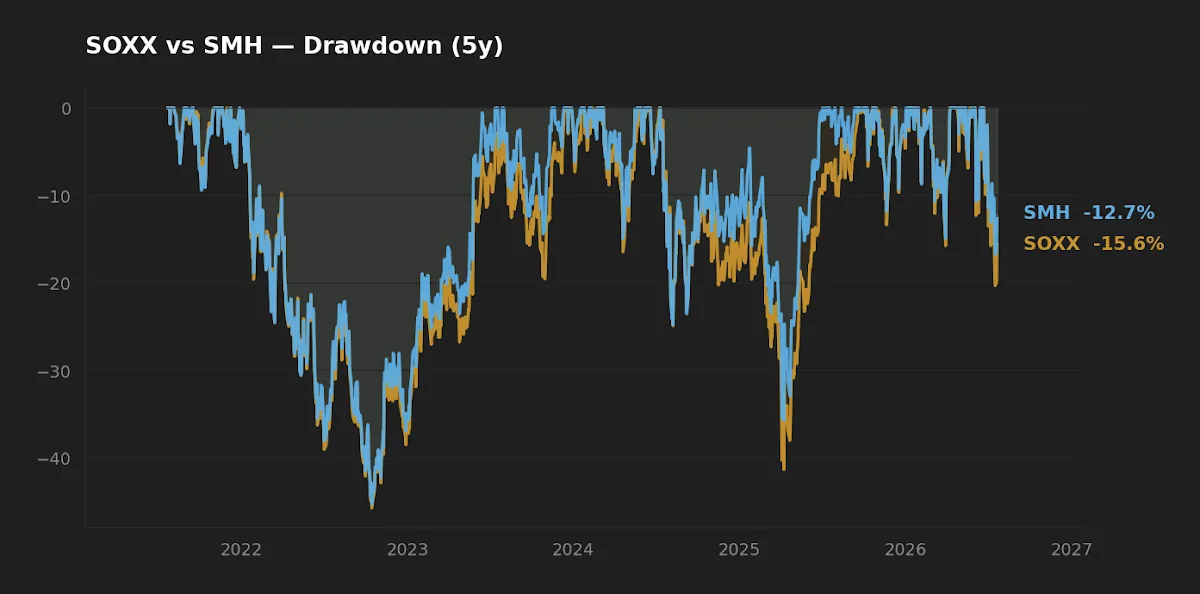
Dispersion within the selloff is the detail most commentary missed. The pain scaled with how pure and how crowded the exposure was. Single names that had already corrected earlier (NVDA from its May peak, TSM from late June) fell less than the thematic funds built to amplify them. The more concentrated and more universally owned the expression, the harder it dropped. That is a signature of crowding, not of deteriorating fundamentals.
Concentration risk: the exposure hiding under "diversified"
Here is the non-obvious mechanism, and the reason Korea is the article's center of gravity rather than a footnote. Cap-weighted indexing rewards whatever has recently won. After a multi-year AI boom, that meant semiconductors quietly grew into an outsized share of many "diversified" portfolios — the Nasdaq-100, large-cap growth funds, even total-market indices, and above all the national indices of chip-exporting economies. Samsung Electronics and SK Hynix together make up a very large slice of the cap-weighted KOSPI. So when the global memory and AI-chip trade unwound, Korea's national index did not behave like a diversified country bet. It behaved like a concentrated semiconductor position, and it fell −22.2%.
Taiwan is instructive as the control case. It is also chip-heavy, but its index carries more of the world's foundry base and a broader industrial mix, and it fell only −5.8%. The gap between −22.2% and −5.8% is the gap between an index that had become a single crowded factor and one that had not. An investor who believed a KOSPI allocation was diversifying away from their U.S. tech exposure was, in factor terms, doubling it.
This is why understanding true factor exposure beneath the label matters more than the label itself — a theme worth reading alongside how factor loadings drift over time and how to measure overlap between funds you assume are distinct. Two holdings can look different on the label and load on the same factor underneath.
Crowding, factor decay, and what a long-horizon investor does
Crowding compounds the problem in a way the historical backtest tends to hide. McLean and Pontiff (2016), "Does Academic Research Destroy Stock Return Predictability?" (Journal of Finance), found that documented return premia decay roughly 26–58% out-of-sample once they are published and capital crowds in. The momentum premium itself is widely estimated to have fallen from around 10% annually in the 1990s toward low-single digits more recently as strategies grew crowded. A premium that everyone is harvesting is a premium that unwinds faster and deeper when sentiment turns — because the marginal holder has no independent conviction, only the trade.
Initially I read the July move as the start of a fundamental re-rating of AI capital spending. Then I looked at where prices sat relative to their long-term trend and at the dispersion across expressions, and it didn't hold up: this was a crowded position mean-reverting, not an earnings thesis breaking. That distinction changes nothing about what a long-horizon investor should do — and that is the point.
The disciplined response is not to forecast the bottom. Nobody rings a bell at the top of a crowded trade. It is four unglamorous habits: know your true factor exposure beneath the diversified label; let rebalancing bands harvest divergence mechanically rather than by prediction; size positions so a −20% sector move is survivable without forced selling; and stay humble about prediction. Faithfulness in the small things — the basis points, the position sizes, the bands — is what carries a portfolio across a cycle like this one.
Scoreboard: SOXX vs SMH
| Category | Edge | Why |
|---|---|---|
| Cost | SOXX (marginal) | 0.34% vs 0.35% — a 1 bp gap, effectively a tie. |
| Realized return (5Y) | SMH | 36.0% vs 31.1% CAGR, driven by heavier top-name weighting. |
| Realized risk | Tie | ~36–38% vol, ~−45% max 5Y drawdown for both. |
| Suitability | Depends | SMH = more concentrated bet on the largest chipmakers; SOXX = broader U.S. roster. |
Frequently asked questions
Did semiconductors crash in July 2026? The broad U.S. chip ETFs fell sharply from their June peaks — SOXX −15.6%, SMH −12.7% (peak-to-2026-07-22, yfinance) — but stayed above their long-term moving averages, which is more consistent with a momentum unwind than a fundamental collapse. Both figures sit well inside each fund's five-year maximum drawdown of roughly −45%.
Why did Korea's KOSPI fall more than the U.S. chip sector? Cap-weighted Korean equity is unusually concentrated in memory and semiconductor names. When the global AI-chip trade unwound, the KOSPI (−22.2%) behaved like a concentrated sector bet rather than a diversified national index. Taiwan's TAIEX, with a broader base, fell only −5.8%.
What is the difference between SOXX and SMH? Both are large U.S.-listed semiconductor ETFs with near-identical fees (0.34% vs 0.35%). SMH is larger ($77.2B vs $47.8B AUM) and more concentrated in the biggest chipmakers; SOXX spreads across a broader roster. The concentration explains SMH's higher realized 5Y CAGR (36.0% vs 31.1%) and is the main structural distinction.
Was this selloff caused by interest rates or the economy? The macro backdrop was calm — VIX at 18.65, the 10-year Treasury at 4.6%, CPI at 3.7% year-over-year (FRED, mid-2026). This looked like a crowded factor mean-reverting rather than a rate or liquidity shock.
How should a long-term investor respond to a semiconductor drawdown? By not trying to time the bottom. The evidence-based approach is to understand true factor exposure beneath "diversified" labels, let rebalancing bands act mechanically, and size positions so a −20% sector move is survivable. Prediction is the weakest tool available here.
Key takeaways
- The July 2026 chip selloff (SOXX −15.6%, SMH −12.7% from June peaks) reads as a momentum unwind, not a fundamental break — trends bent but held above long-term averages.
- Korea's KOSPI (−22.2%) fell harder than the U.S. chip sector because cap-weighting had turned a national index into a concentrated semiconductor bet.
- Crowding deepens unwinds: published premia decay out-of-sample (McLean & Pontiff 2016), and momentum crashes are sudden and skewed (Barroso & Santa-Clara 2015).
- SOXX and SMH are near-identical on fees and risk; SMH's edge in realized return traces to concentration, which is a feature and a liability at once.
- The durable lesson is structural, not tactical: know your real factor exposure, rebalance by rule, and size for survivability rather than forecast.
Methodology: drawdowns and CAGR/volatility figures computed locally from adjusted daily closes (yfinance, fetched 2026-07-22); expense ratio and AUM from iShares and VanEck issuer fact sheets; macro rates from FRED (as of dates cited inline). Window analyzed: peak-to-2026-07-22 for drawdowns, trailing 5 and 10 years for return and risk.
This article is for educational purposes and does not constitute personalized financial advice. See our full Disclaimer.