
Photo by Radek Kozák on Unsplash
The short version
- The credit spread pays you for default risk — but over the last five years, the fund that lost more was the investment-grade one, not the high-yield one. The reason is duration, not credit.
- LQD carries a 0.14% expense ratio and a deeper realized drawdown (−25.0%); HYG costs 0.49% and drew down less (−15.8%), because its shorter duration cushioned the 2022 rate shock.
- Bottom line: LQD is a rate-and-credit instrument dressed as a "safe" bond fund; HYG is a credit-and-equity-beta instrument dressed as a bond fund. Neither is a cash substitute.
The standard framing is that investment-grade bonds are the cautious choice and high-yield is where you reach for risk. LQD holds the debt of investment-grade issuers; HYG holds below-investment-grade credit and pays you more to hold it. The central question is whether that extra yield actually compensates you for the extra risk — and, more usefully, which risk each fund is really selling you. Because over the trailing five years, the risk that hurt most did not come from the fund most people call risky.
Ninety seconds of context
A corporate bond pays a yield above the equivalent Treasury. That gap — the credit spread — is compensation for the chance the issuer defaults or gets downgraded. Investment-grade issuers (BBB− and up) rarely default, so their spreads are thin. High-yield issuers (BB+ and down) default more often, so their spreads are wide. iShares packages both: LQD tracks a broad investment-grade index, HYG tracks a liquid high-yield index. Both launched into the ETF era early — LQD in 2002, HYG in 2007 — so each has lived through at least one full credit cycle.
The part the "spread pays you for default risk" story leaves out: a bond's price also moves with interest rates, and that sensitivity is duration. Investment-grade corporates tend to be issued at longer maturities than high-yield paper, so LQD carries meaningfully more duration than HYG. When the 10-year Treasury climbed through 2022, long duration was the wound — not defaults. For context, the 10-year sat at 4.58% and the Fed funds rate at 3.63% as of mid-2026 (FRED, asof 2026-07-14 and 2026-06-01), a regime that keeps duration front of mind.
The data
| Metric | LQD | HYG |
|---|---|---|
| Segment | Investment-grade corp | High-yield corp |
| Expense ratio | 0.14% | 0.49% |
| AUM | $33.1B | $17.6B |
| Inception | 2002-07-22 | 2007-04-04 |
| Distribution yield | 4.6% | 5.9% |
| 5Y CAGR | −0.7% | 3.7% |
| 10Y CAGR | 2.1% | 4.8% |
| 5Y volatility (annualized) | 8.6% | 7.5% |
| 5Y max drawdown | −25.0% | −15.8% |
Sources: price and return series from yfinance (fetched 2026-07-16); expense ratio, AUM, and yield from iShares issuer fact sheets (LQD, HYG). CAGR, volatility, and drawdown computed on total-return series over the trailing 5- and 10-year windows.
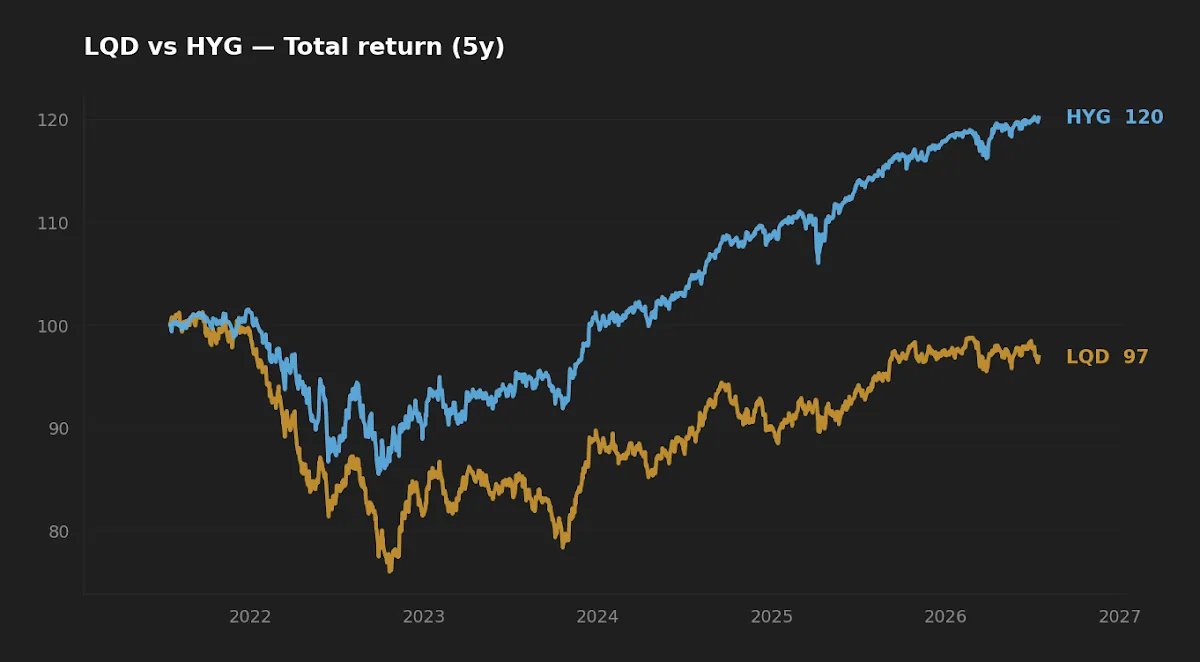
Where the return actually came from
Read the five-year numbers slowly. HYG — the fund with the worse credit and the higher fee — compounded at 3.7% a year. LQD — the "safer," cheaper fund — compounded at negative 0.7%. Over ten years the ordering holds: 4.8% for HYG against 2.1% for LQD. On the face of it, that inverts the risk-reward story entirely.
It doesn't, though. It just relocates the risk. LQD's poor five-year showing is almost entirely a duration story: its longer-dated holdings repriced hard as rates rose off the 2020–2021 lows, and a −0.7% CAGR is what that repricing looks like from the inside. HYG's shorter duration meant less rate sensitivity, so it kept more of its coupon. The extra yield HYG paid you was real, and in a rising-rate window the lower duration was worth more than the credit risk cost you. Different regime, different verdict — in a 2008-style default wave, the ranking would flip violently.
LQD is a rate-and-credit instrument dressed as a safe bond fund; HYG is a credit-and-equity-beta instrument dressed as a bond fund. The label on the tin is the least useful thing about either.
Realized risk: the drawdown tells on both funds
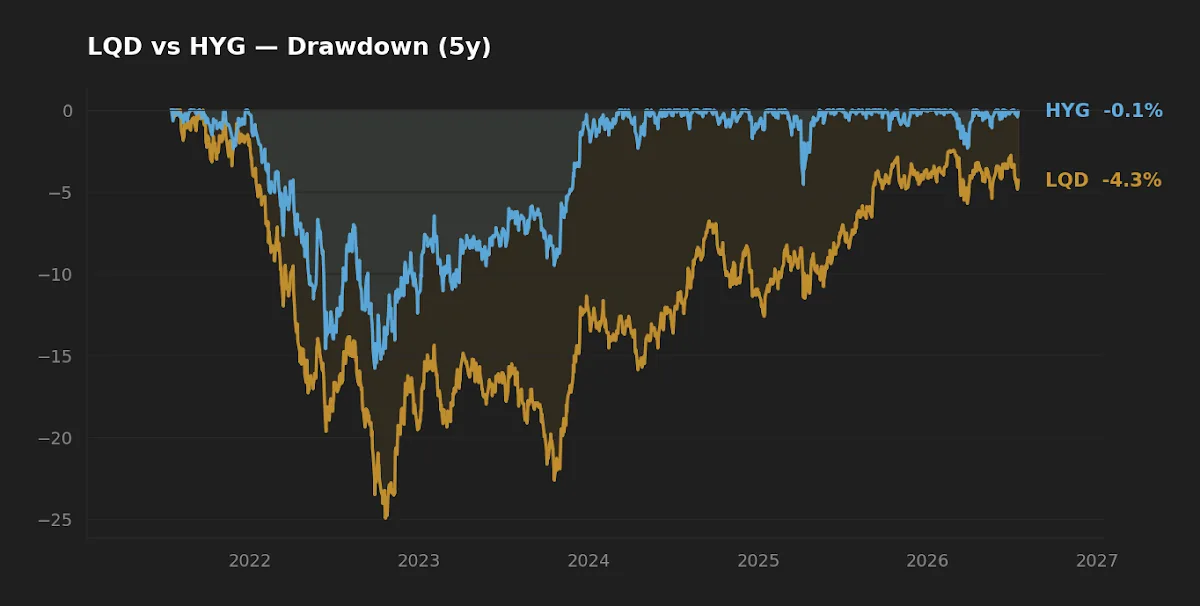
Here is the finding most spread commentary buries. Over the trailing five years, LQD's maximum drawdown was −25.0% and HYG's was −15.8%. The investment-grade fund fell further. If you assumed "investment-grade equals shallower losses," the data says otherwise for this window — because the dominant loss driver was duration, and LQD has more of it.
This is the non-obvious point worth sitting with: LQD and HYG do not draw down for the same reason. LQD's worst moments coincide with rate shocks; HYG's coincide with credit-risk-off episodes, which tend to arrive alongside equity selloffs. So HYG's 7.5% annualized volatility understates its tail risk — its losses are correlated with the very equity drawdowns a bond sleeve is supposed to offset. LQD's 8.6% volatility, by contrast, is more about rates than about your stock book. Initially I filed HYG under "bonds." Then I looked at when its drawdowns actually occurred, and it behaves closer to a subordinated slice of equity risk. That correlation timing — not the headline vol number — is what matters for a portfolio's behavior in stress. It's the same distinction that separates volatility from permanent loss: the number you can measure isn't always the risk that hurts you.
Cost, scale, and implementation friction
The fee gap is 0.35% — HYG at 0.49% versus LQD at 0.14%. That is not trivial for a bond fund whose entire expected return lives in coupon and spread. High-yield is more expensive to run: the underlying bonds trade less, the index turns over more, and liquidity has to be paid for. But the friction doesn't stop at the expense ratio. HYG's high-yield holdings carry wider bid-ask spreads, so the true cost of round-tripping is higher than the headline fee, and in a stress event its market price can dislocate from NAV precisely when you'd want to sell. LQD, larger at $33.1B AUM against HYG's $17.6B and holding more liquid paper, trades tighter.
There is also a tax dimension. Both funds distribute interest income taxed as ordinary income, not qualified dividends — so in a taxable account, the higher-yielding HYG delivers more of its return in the least tax-efficient form. That matters more than the fee gap for some investors, and it's a reason credit ETFs often belong in tax-advantaged space. The same logic that governs after-tax compounding applies here: the pre-tax yield is not what you keep.
What the spread is actually paying you for
Strip it down and the credit spread compensates you for two things bundled together: expected default losses, and the risk that spreads widen (marking your bonds down) before those defaults ever materialize. Most of the time, defaults are low and the second component — mark-to-market spread risk — dominates the ride. That's why HYG can look placid for years and then lurch when risk sentiment turns. You are, in effect, short a put on corporate solvency. The premium shows up as yield; the cost shows up all at once. For a total-bond alternative that dilutes both duration and credit into a single government-heavy blend, the BND versus AGG comparison covers the other end of the spectrum.
Editor's read
Neither of these is a core holding in the editor's framework — the long-horizon fixed-income sleeve leans on shorter-duration, higher-quality exposure whose job is to be boring during equity drawdowns. Between the two, if the mandate were an income satellite held in a tax-advantaged account, HYG's shorter duration and higher realized return over both windows make it the more defensible pick despite the 0.49% fee — provided the holder genuinely understands its losses are correlated with equity selloffs. LQD earns a place only for someone who specifically wants investment-grade duration as a rate bet, and who is buying it with eyes open about the −25.0% it delivered when rates moved.
| Category | Winner | Why |
|---|---|---|
| Cost | LQD | 0.14% vs 0.49%; tighter spreads at larger AUM |
| Realized risk (5Y drawdown) | HYG | −15.8% vs −25.0%; shorter duration cushioned the rate shock |
| Realized return (5Y & 10Y) | HYG | 3.7% / 4.8% vs −0.7% / 2.1% |
| Diversification value in equity stress | LQD | Losses driven by rates, less correlated with stock drawdowns |
Frequently asked questions
Why did the investment-grade fund (LQD) lose more than the high-yield fund (HYG)?
Duration. LQD holds longer-dated bonds, so it fell harder when interest rates rose. Its −25.0% five-year max drawdown reflects rate risk, not defaults. HYG's shorter duration meant less rate sensitivity, so it drew down only −15.8% over the same window (yfinance, 2026-07-16).
Is HYG's higher yield worth the higher fee?
HYG yields 5.9% against LQD's 4.6% and costs 0.49% versus 0.14% (iShares fact sheets). Over the trailing five and ten years, HYG's higher gross return more than covered the fee gap. Whether that repeats depends on the credit cycle — in a default wave, the extra yield can be erased quickly.
Are these bond funds safe to use as a cash substitute?
No. Both carry material price risk. LQD's −25.0% and HYG's −15.8% drawdowns are far outside anything a cash or money-market position would experience. They are total-return credit instruments, not capital-preservation vehicles.
Does HYG diversify an equity portfolio?
Less than its "bond" label implies. High-yield credit tends to sell off alongside equities, so HYG's losses are correlated with the stock drawdowns a bond sleeve is meant to offset. LQD, whose losses track rates more than credit sentiment, offers somewhat more diversification against equity stress.
Where should these funds sit for tax purposes?
Both distribute ordinary-income interest, not qualified dividends. In a taxable account, the higher-yielding HYG is the more tax-inefficient of the two. Many investors hold credit ETFs in tax-advantaged accounts for that reason.
What this comparison can and can't tell you
The five- and ten-year windows here are dominated by one regime: the 2020 lows, the 2022 rate shock, and the recovery since. They contain a major rate move but not a full-blown default cycle. That biases the results in HYG's favor — its worst historical stress (2008-style credit collapse) is outside the window entirely. A single-regime sample cannot tell you how either fund behaves when defaults spike, and it cannot rule out that the next decade rewards duration rather than punishing it. Treat the drawdown figures as one draw from the distribution, not the distribution.
Scenarios where each fund fits
- Reader in their 30s, 401(k)-only, no current bond exposure: neither is a natural first fixed-income holding — a broad total-bond fund covers the sleeve with less concentrated risk.
- Income-focused investor with tax-advantaged space and a strong stomach: HYG as a small credit satellite, sized in full awareness that its drawdowns cluster with equity selloffs.
- Investor making a deliberate rate call: LQD as an expression of investment-grade duration — a bet that rates fall — not as a defensive default holding.
Key takeaways
- The credit spread pays for default risk and spread-widening risk, but over the last five years duration — not defaults — drove the losses, and LQD carries more of it.
- HYG outperformed on return (3.7% vs −0.7% over 5Y) and lost less (−15.8% vs −25.0%), inverting the usual "investment-grade is safer" intuition for this window.
- HYG's real risk is its correlation with equity drawdowns; LQD's real risk is rates. The volatility numbers alone won't tell you that.
- The 0.35% fee gap plus wider bid-ask spreads and ordinary-income taxation make HYG's true cost higher than its headline expense ratio.
- Neither fund is a cash substitute, and a single-regime sample can't show you how either behaves in a genuine credit crisis.
Methodology
Price and total-return series were pulled from yfinance on 2026-07-16, covering trailing 5- and 10-year windows through that date. CAGR, annualized volatility, and maximum drawdown were computed on total-return series. Expense ratio, AUM, distribution yield, and inception dates come from the iShares issuer fact sheets for LQD and HYG. Macro reference figures (10-year Treasury 4.58%, Fed funds 3.63%) are from FRED, asof 2026-07-14 and 2026-06-01. Figures are rounded to one decimal place.
This article is for educational purposes and does not constitute personalized financial advice. See our Disclaimer.