
Photo by Pawel Czerwinski on Unsplash
The short version
- ITA and XAR own the same sector but weight it differently — ITA is capped market-cap and concentrated; XAR is modified equal-weight with a persistent size tilt.
- That weighting choice, not the 0.03% fee gap, drives the numbers: XAR posted a higher 10-year CAGR (17.9% vs 15.4%) but a much deeper 5-year drawdown (−30.4% vs −18.7%).
- Bottom line: ITA is the smoother, more liquid core-sector holding; XAR is a higher-beta expression of the same theme, and buying either "because geopolitical risk is rising" is usually buying after the premium is already in the price.
The question that brings most readers to a defense-and-aerospace ETF is timing: headlines are loud, budgets are rising, and the instinct is to buy the theme. The more useful question is structural — given two funds tracking nearly the same universe of stocks, why does one carry meaningfully more realized risk than the other, and which exposure actually belongs in a long-horizon portfolio? That is where ITA and XAR separate, and it has almost nothing to do with the near-identical expense ratios.
Context: two funds, same sector, different machinery
The iShares U.S. Aerospace & Defense ETF (ITA) tracks a capped market-capitalization index of U.S. aerospace and defense names. Capitalization weighting means the largest primes — the Boeings, RTXs, Lockheeds of the group — dominate the fund, subject to concentration caps that keep any single name from swallowing the portfolio. The SPDR S&P Aerospace & Defense ETF (XAR) tracks a modified equal-weight index of the S&P Total Market aerospace-and-defense segment. Equal weighting deliberately flattens the giants and lifts the smaller suppliers, avionics makers, and mid-cap contractors.
That single design difference — cap-weight versus equal-weight — is the whole story. It changes the funds' factor exposure (XAR carries a size tilt toward smaller companies), their volatility, their drawdown behavior, and the regimes in which each one leads. Both launched into the same theme; ITA in 2006, XAR in 2011. Both charge fees that round to the same third of a percent. Everything else that matters flows from how they distribute weight.
The data
| Metric | ITA | XAR |
|---|---|---|
| Name | iShares U.S. Aerospace & Defense | SPDR S&P Aerospace & Defense |
| Weighting scheme | Capped market-cap | Modified equal-weight |
| Expense ratio | 0.38% | 0.35% |
| AUM | $14.4B | $6.5B |
| Inception | 2006-05-01 | 2011-09-28 |
| Dividend yield | 0.4% | 0.3% |
| 5Y CAGR | 17.7% | 15.8% |
| 10Y CAGR | 15.4% | 17.9% |
| 5Y annualized volatility | 20.2% | 23.7% |
| 5Y max drawdown | −18.7% | −30.4% |
Return and risk figures are computed from adjusted daily closes via yfinance (data pulled 2026-07-16); expense ratio, AUM, yield, and inception are from the iShares and SSGA issuer fact sheets. One immediate note: both dividend yields (0.4% and 0.3%) are trivial next to the 4.58% 10-year Treasury (FRED, asof 2026-07-14). Neither fund is an income instrument. These are capital-appreciation vehicles, and any comparison should be judged on total return and realized risk, not distributions.
Why the 5-year and 10-year rankings disagree
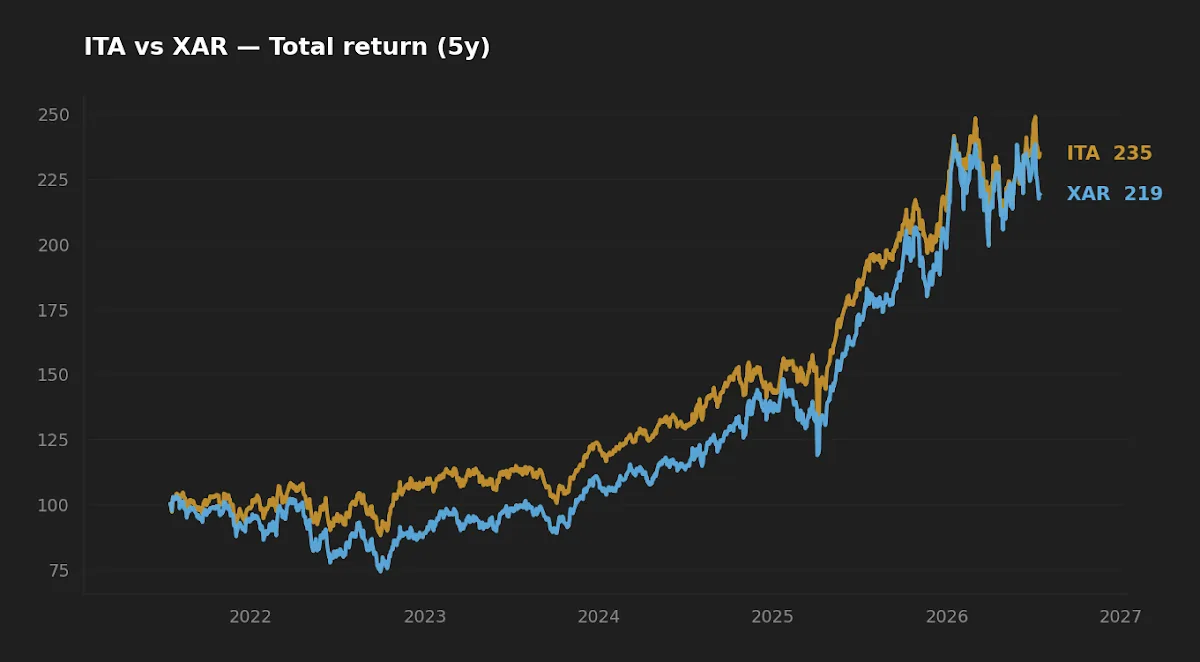
The table contains an apparent contradiction worth sitting with. Over ten years XAR won on CAGR — 17.9% versus 15.4%. Over five years the ranking flipped — ITA led at 17.7% versus 15.8%. Same two funds, opposite verdicts, depending on where you draw the window.
This is the size tilt showing up as regime dependence. XAR's equal-weight construction gives smaller aerospace-and-defense names an outsized share of the portfolio relative to their market value. When smaller and mid-cap suppliers lead — which they did across parts of the last decade — XAR compounds faster. When the mega-cap primes lead, or when investors crowd into the largest, most liquid defense names during a risk-driven rally, ITA's concentration works in its favor. The five-year window happens to capture more of the latter.
Initially I read XAR's ten-year edge as a durable structural advantage of equal weighting. Then I looked at the rolling behavior and the drawdown record, and it did not hold up as a free lunch — the excess return came bundled with materially more risk, and it arrived in specific regimes rather than steadily. That is the difference between a factor premium you are compensated for and a period-specific outcome you happened to catch.
XAR's ten-year return edge was not a free lunch — it was a size-factor bet that paid in one regime and charged a 30% drawdown in another.
Realized risk: where the weighting scheme sends the bill
The clearest evidence sits in the risk column. XAR's five-year annualized volatility of 23.7% runs about 3.5 percentage points above ITA's 20.2%. More telling is the peak-to-trough: XAR drew down 30.4% over the five-year window against ITA's 18.7%. That is not a rounding difference — it is roughly 1.6 times the depth, from two funds holding largely overlapping companies.
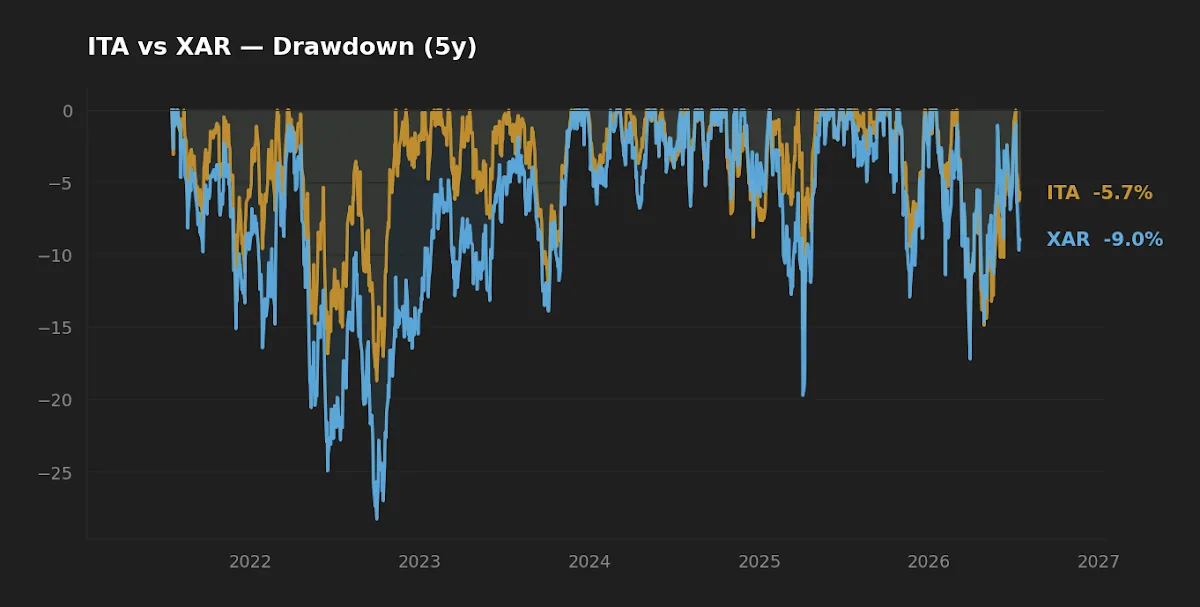
Equal weighting is the mechanism. By holding more of the smaller, less-liquid, higher-beta suppliers, XAR inherits their sharper selloffs. Small and mid-cap industrials tend to fall harder and take longer to recover when the market repriced risk, and an equal-weight index rebalances toward whatever has fallen — mechanically topping up the names that just dropped. That is a rational, disciplined process over a full cycle, but it is also why the drawdown is deeper and the ride is rougher. ITA, anchored by the large primes, has a shallower trough and a shorter drawdown duration.
The non-obvious point: sector concentration cuts both ways with the macro backdrop. As of mid-2026 the VIX sat at 16.5 (FRED, asof 2026-07-14) — a calm volatility regime, not a stressed one, despite the "rising geopolitical risk" framing that usually accompanies this trade. Realized-risk numbers measured in calm periods understate what an equal-weight, size-tilted sector fund can do when volatility actually spikes. The −30.4% is the record of a relatively benign window, not a worst case.
The timing trap
Most readers arrive at defense ETFs after a wave of headlines. That is precisely the problem. Markets price expectations, not news, and by the time a conflict or a budget increase is the top story, a good deal of the associated premium is already in the share price. This is the same pattern the data shows in energy: I've written about how energy equities and geopolitical conflict only reliably move together under specific conditions, and how geopolitical risk premia show up in returns often before the average investor acts. Buying a theme because it feels urgent is buying after the market has repriced it — the opposite of the discipline a long horizon rewards. If a sector tilt belongs in a portfolio, it belongs there as a deliberate, sized allocation held across cycles, not as a reaction to a news cycle. The same logic that governs risk management and strategic cash applies: the decision should be made before the headline, not because of it.
Scoreboard
| Category | Winner | Why |
|---|---|---|
| Cost | XAR (marginal) | 0.35% vs 0.38% — a 0.03% gap, essentially a tie |
| Realized risk | ITA | Lower 5Y vol (20.2%) and shallower drawdown (−18.7%) |
| Realized return | Split | ITA led 5Y; XAR led 10Y — window-dependent |
| Liquidity / scale | ITA | $14.4B AUM vs $6.5B — tighter spreads, deeper book |
| Suitability as core-sector sleeve | ITA | Smoother, more liquid, less size-factor noise |
What this comparison can and can't tell you
The five-year and ten-year figures cover a specific stretch of market history — a period without a prolonged defense-sector bear market and, at the moment of measurement, a low-volatility regime. The drawdown numbers are the worst these funds happened to post in that window, not a modeled stress scenario. Neither figure tells you how an equal-weight, size-tilted fund behaves in a genuine liquidity crunch, when smaller suppliers can gap down and spreads widen. CAGR is also sensitive to endpoints; shift the window by a year and the ITA-versus-XAR ranking can move, as the 5Y/10Y disagreement already demonstrates. Treat these as descriptions of realized behavior, not forecasts.
Scenarios where each fund fits
- Reader who wants one long-term sector sleeve, prioritizing liquidity and a smoother ride: ITA's cap-weighted structure, larger AUM, and shallower drawdown make it the lower-friction default.
- Reader deliberately seeking a small-cap / size tilt within the theme, and comfortable with a rougher path: XAR's equal weighting is a coherent way to express that, provided the drawdown record is understood in advance.
- Reader tempted to add either because of current headlines: the more honest move is to decide the target allocation first and size it small, rather than let a news cycle set the position.
- Reader already broadly diversified in a low-cost core: a single-sector fund at 0.35–0.38% is a satellite, not a foundation — its role is a modest tilt, not a building block.
Editor's read
If forced to hold one as a long-term sector sleeve, the editor leans toward ITA. The 0.03% fee gap is noise; the real trade is XAR's size tilt, and the data shows that tilt delivered its extra return in a specific regime while charging a drawdown roughly 1.6 times as deep. For a satellite position meant to be held across cycles rather than traded around headlines, the smoother, more liquid, cap-weighted exposure is the more defensible choice. XAR is legitimate — but as a conscious, sized bet on smaller aerospace-and-defense names, not as a default.
The editor does not hold either fund at the time of writing.
FAQ
Is XAR riskier than ITA? By realized measures, yes. Over the five-year window XAR showed higher annualized volatility (23.7% vs 20.2%) and a deeper maximum drawdown (−30.4% vs −18.7%), driven by its equal-weight tilt toward smaller, higher-beta holdings (yfinance, 2026-07-16).
Why did XAR beat ITA over ten years but lag over five? XAR's equal weighting gives smaller names outsized influence. When those names led, XAR compounded faster (17.9% 10Y CAGR); when the large primes led, ITA won (17.7% 5Y CAGR). The disagreement is a feature of the size tilt, not a data error.
Does the expense-ratio difference matter? Barely. At 0.38% (ITA) versus 0.35% (XAR), the 0.03% gap is dwarfed by the difference in realized volatility and drawdown. The weighting scheme, not the fee, determines the outcome here.
Are these good income funds? No. Yields of 0.4% (ITA) and 0.3% (XAR) are negligible against the 4.58% 10-year Treasury (FRED, asof 2026-07-14). Both are capital-appreciation vehicles and should be judged on total return and risk.
Should I buy a defense ETF because geopolitical risk is rising? That framing is a timing trap. Markets price expectations ahead of headlines, so much of the premium is often already reflected by the time a theme feels urgent. A sector tilt is more defensible as a pre-decided, sized allocation held across cycles than as a reaction to news.
Key takeaways
- ITA and XAR track nearly the same sector; the difference is weighting — capped market-cap versus modified equal-weight — and that difference drives everything.
- XAR carries a size tilt: higher realized volatility (23.7%) and a deeper drawdown (−30.4%) than ITA (20.2%, −18.7%) over the five-year window.
- The 5Y/10Y return disagreement is regime-dependent, not a durable edge — treat XAR's ten-year lead as a paid-for factor bet, not a free lunch.
- The 0.03% fee gap is immaterial to the decision.
- Both are satellite, not core, holdings — and timing the trade to headlines usually means buying after the premium is priced.
Methodology: Price, total return, volatility, and drawdown computed from adjusted daily closes via yfinance, data pulled 2026-07-16; five-year and ten-year windows ending on that date. Expense ratio, AUM, dividend yield, and inception from iShares (ITA) and SSGA/SPDR (XAR) issuer fact sheets. Macro reference figures from FRED (10-year Treasury and VIX asof 2026-07-14; CPI and fed funds asof 2026-06-01).
This article is for educational purposes and does not constitute personalized financial advice. See the full Disclaimer.