
Photo by Nick Fewings on Unsplash
The short version
- XBI weights biotech names roughly equally, tilting hard toward small- and mid-cap clinical-stage companies; IBB is cap-weighted and dominated by a handful of large, profitable firms. That single design choice explains almost every difference that follows.
- Over the trailing five years the two delivered nearly identical returns (XBI 3.6%, IBB 3.5% CAGR) — but XBI took a 54.0% drawdown and 32.3% annualized volatility to get there, versus IBB's 39.8% and 22.1%. Same destination, very different road.
- Bottom line: XBI is a higher-beta, more binary expression of biotech innovation; IBB is a calmer, more concentrated proxy for the sector's established leaders. Neither is a "core" holding.
Two ETFs can carry the same one-word label — "biotech" — and behave like different asset classes. XBI and IBB are the clearest example I know of. The central question is not which fund is better in the abstract, but whether an investor is being paid for the extra risk that XBI's equal-weight construction imposes. Over the window the data covers, the honest answer is: not lately.
That matters because biotech is a sector where the weighting scheme is not a footnote. It changes what you own, how it drops in a stress event, and how long you wait to recover. Below I walk through the construction, the realized numbers pulled on 2026-07-16, and the second-order effects the headline CAGR hides.
Context: what each fund actually holds
IBB (iShares Biotechnology ETF), launched 2001-02-05, tracks a cap-weighted index of U.S.-listed biotech and pharma names. Cap weighting means the largest, most profitable companies dominate. A handful of mega-cap names can account for a meaningful slice of the fund, so IBB behaves a lot like a bet on established, cash-generating biotech leaders — closer to large-cap growth than to the clinical-stage frontier.
XBI (SPDR S&P Biotech ETF), launched 2006-01-31, uses a modified equal-weight scheme across the S&P biotech sub-industry. Equal weighting deliberately caps the influence of the giants and pushes exposure down the market-cap ladder toward small- and mid-cap firms — many pre-revenue, many trading on the binary outcome of a single clinical trial or FDA decision. XBI is therefore a far purer expression of biotech innovation risk, with all the fat tails that implies.
This is the same construction fault line I looked at in SMH vs SOXX for semiconductors and in AVUV vs VBR for small-cap value: the index rulebook, not the sector name, drives the risk profile.
The data
| Metric | XBI | IBB |
|---|---|---|
| Name | SPDR S&P Biotech ETF | iShares Biotechnology ETF |
| Weighting | Modified equal-weight | Cap-weight |
| Expense ratio | 0.35% | 0.44% |
| AUM | $10.7B | $9.1B |
| Inception | 2006-01-31 | 2001-02-05 |
| Dividend yield | 0.4% | 0.2% |
| 5Y CAGR | 3.6% | 3.5% |
| 10Y CAGR | 10.8% | 8.2% |
| 5Y annualized volatility | 32.3% | 22.1% |
| 5Y max drawdown | −54.0% | −39.8% |
Price and return fields are computed from yfinance history pulled 2026-07-16; expense ratio, AUM, and construction are from the issuer fact sheets (State Street, XBI; iShares, IBB). Yields are trailing and, for both funds, effectively rounding error — neither is an income vehicle.
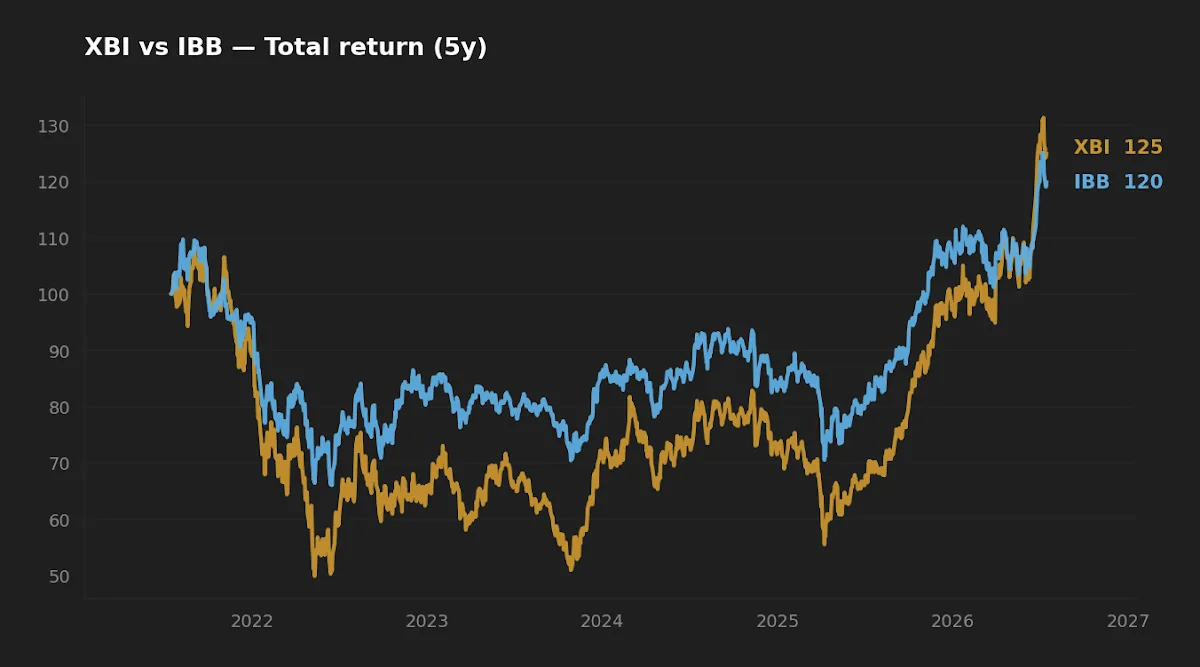
Same return, unequal risk — the trade nobody got paid for
The most useful number in the table is the pair that looks boring: 3.6% versus 3.5% five-year CAGR. Over this window the two funds landed within a rounding margin of each other. But XBI's path to that return ran through 32.3% annualized volatility and a 54.0% peak-to-trough drawdown, while IBB got there on 22.1% volatility and a 39.8% drawdown.
Put in risk-adjusted terms, IBB produced essentially the same return for roughly two-thirds of the volatility. An investor holding XBI over the trailing five years bore materially more variance and a much deeper hole without a return premium to show for it. This is the kind of asymmetry a single performance figure hides, and it is exactly why realized volatility and drawdown belong next to CAGR rather than in a footnote.
Over the trailing five years XBI took a 54% drawdown and half again as much volatility as IBB — and finished at the same place. That is the sector paying nothing for the extra risk.
Realized risk: why the drawdown gap is structural, not bad luck
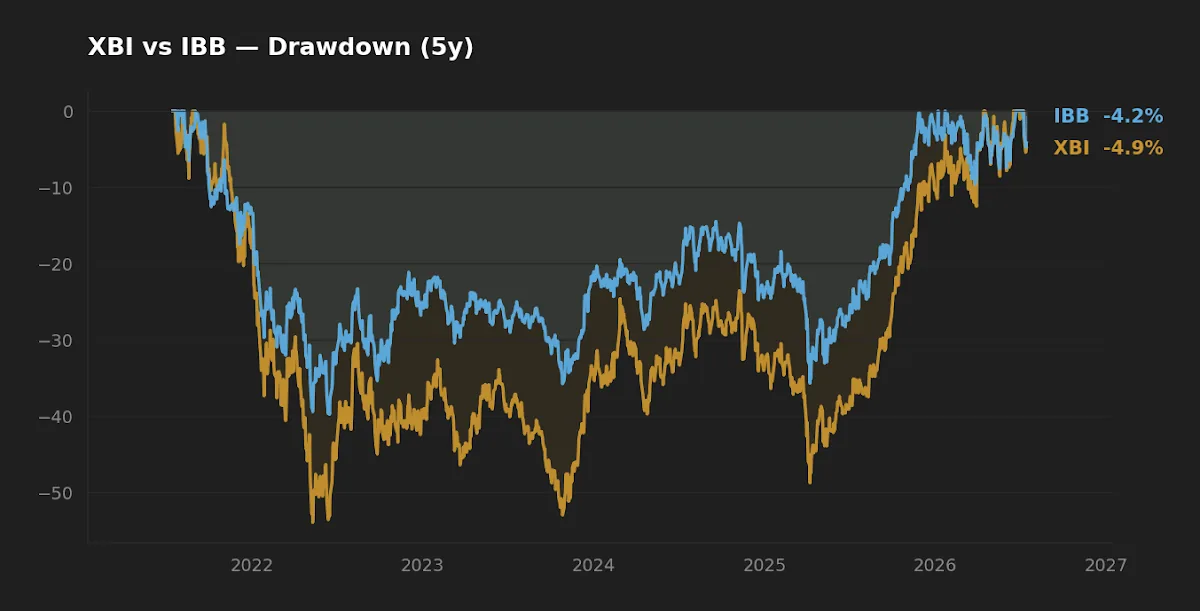
The 14-point drawdown gap is not an accident of one bad quarter. It falls directly out of construction. Equal weighting loads XBI toward small-cap, pre-profit biotech, and small-cap biotech is one of the most rate-sensitive corners of the equity market. When the 10-year Treasury sits near 4.6% (FRED, asof 2026-07-14), the present value of a company whose cash flows are a decade out gets marked down hard. The 2021–2023 small-cap biotech drawdown — the deepest part of XBI's five-year path — coincided with exactly that repricing.
IBB, weighted toward firms that already generate cash, carries less duration in that sense. Its drawdown was still severe at 39.8%, but the cap-weighted tilt toward profitable names cushioned it. The drawdown chart above shows the two lines diverging most in the deepest part of the cycle — which is precisely when a holder feels it.
The behavioral point follows. A 54% drawdown is not just a bigger number than 40%; it demands a 117% recovery to break even versus 66%. Drawdown duration — how long you sit underwater — is where discipline actually gets tested, and XBI tests it harder. An investor who cannot hold through that will convert a paper drawdown into a realized loss at the worst moment.
The 10-year picture, and the regime warning inside it
Here is where I have to correct a first instinct. Look only at the five-year data and XBI looks like pure downside — same return, more pain. But the 10-year CAGR tells the opposite story: XBI compounded at 10.8% versus IBB's 8.2%, a 2.6-point annual edge over the decade. Equal-weight's small-cap tilt was richly rewarded across the 2016–2021 stretch before the recent rate shock erased the premium.
Initially I read the identical five-year returns as proof that equal weighting adds nothing here. Then I put the 10-year window next to it, and the cleaner reading is a regime story: XBI's small-cap tilt is a high-beta bet that pays in easy-money, risk-on regimes and gets punished when duration is repriced. The five-year and ten-year numbers are not contradictory — they are two different monetary regimes captured in one dataset. That is the single most important thing this comparison can teach, and it is also its main limitation: two windows are not enough to separate skill of construction from luck of timing.
Cost and implementation
IBB charges 0.44% and XBI 0.35%, a 0.09% gap in XBI's favor. On a sector satellite that is real but secondary — 9 basis points a year is dwarfed by a 10-point volatility difference and a 14-point drawdown gap. Cost discipline matters and compounds, but here it is not the deciding variable; the risk profile is.
Both funds are liquid, with AUM of $10.7B (XBI) and $9.1B (IBB), so bid-ask spread and closure risk are non-issues for a long-term holder. One implementation nuance worth flagging: XBI's equal weight requires periodic rebalancing back to target weights, which can generate more turnover — and potentially more short-term capital gains distributions — than IBB's lower-maintenance cap-weighted index. For a taxable account, that turnover is worth checking against each fund's distribution history before committing.
Scoreboard
| Category | Winner | Why |
|---|---|---|
| Cost | XBI | 0.35% vs 0.44% — 9 bp cheaper. |
| Realized risk (5Y) | IBB | Lower volatility (22.1% vs 32.3%) and shallower drawdown (−39.8% vs −54.0%). |
| Realized return (5Y / 10Y) | Tie / XBI | Nearly identical over 5Y; XBI led by 2.6 pts/yr over 10Y. |
| Suitability as a satellite | Depends on regime view | XBI for high-beta innovation exposure; IBB for a calmer sector proxy. |
Scenarios where each fits
Reader in their 30s, long horizon, small satellite sleeve, comfortable with deep drawdowns: XBI expresses the innovation thesis more purely and has the stronger long-window record — but only if the drawdown can genuinely be held through.
Reader who wants sector exposure without the small-cap tail: IBB's cap-weighted tilt toward profitable leaders delivered similar recent returns with meaningfully less variance.
Reader looking for a core holding or income: neither. Both are single-sector, high-volatility, near-zero-yield vehicles. Sizing as a small satellite, not a core position, is the disciplined framing.
What this comparison can and can't tell you
The five- and ten-year windows here cover a specific sequence: a risk-on biotech run, a rate-driven small-cap drawdown, and a partial recovery. They do not cover a full multi-cycle sample, and they cannot separate construction skill from regime timing — the divergence between the 5Y and 10Y numbers is the direct evidence of that. Trailing volatility and drawdown are backward-looking; they describe how these funds did behave, not a guarantee of how they will. Treat the numbers as a description of realized risk, not a forecast.
Editor's read
If forced to hold one as a small biotech satellite, the editor leans toward IBB — not because equal weighting is inferior, but because the trailing five years show XBI's extra volatility and 54% drawdown went unrewarded, and I want a return premium before I accept that kind of variance. The 10-year edge for XBI is real and regime-dependent; a reader with a genuine multi-decade horizon and the temperament to sit through a 117%-recovery hole has a defensible case for it. For most, IBB's calmer profile is the more honest match to how the risk actually gets experienced.
The editor holds neither XBI nor IBB at the time of writing.
FAQ
Is XBI riskier than IBB? By the realized numbers, yes. Over the trailing five years XBI showed 32.3% annualized volatility and a 54.0% max drawdown versus IBB's 22.1% and 39.8% (yfinance, 2026-07-16). Its equal-weight construction tilts toward small-cap biotech, which is more volatile.
Why did XBI and IBB return almost the same over five years if their risk is so different? The recent window included a deep small-cap biotech drawdown that hit XBI harder, closing what had been a wide performance gap. Over ten years XBI still led (10.8% vs 8.2% CAGR). The five-year tie is a regime artifact, not a permanent state.
What is the difference between equal-weight and cap-weight biotech? Cap-weight (IBB) gives the largest, most profitable firms the most influence. Equal-weight (XBI) caps that and spreads exposure toward smaller, often pre-profit companies — more innovation upside, more binary clinical-trial risk.
Which is cheaper? XBI, at 0.35% versus IBB's 0.44% — a 0.09% annual gap (issuer fact sheets). The difference is modest relative to the funds' risk gap.
Are these suitable as a core holding? Neither is designed for that. Both are single-sector, high-volatility funds with negligible yield. They fit better as a small, deliberately sized satellite than as a portfolio anchor.
Key takeaways
- XBI's equal weight tilts toward small-cap biotech; IBB's cap weight concentrates in large, profitable names — construction drives everything else.
- Over five years the two returned the same (3.6% vs 3.5% CAGR) while XBI carried far more volatility and a 14-point deeper drawdown — extra risk that went unpaid in this window.
- Over ten years XBI led by 2.6 points a year; the split between the two windows is a regime story, not a construction verdict.
- The 9 bp fee gap favors XBI but is minor next to the risk difference.
- Both are satellite-sized sector bets, not core holdings.
Methodology: return, volatility, and drawdown fields computed from yfinance daily price history pulled 2026-07-16 (trailing 5- and 10-year windows); expense ratio, AUM, weighting scheme, and inception from issuer fact sheets; macro reference from FRED (10-year Treasury 4.6%, asof 2026-07-14).
This article is for educational purposes and does not constitute personalized financial advice. See our Disclaimer.