
Photo by Marcus Reubenstein on Unsplash
The short version
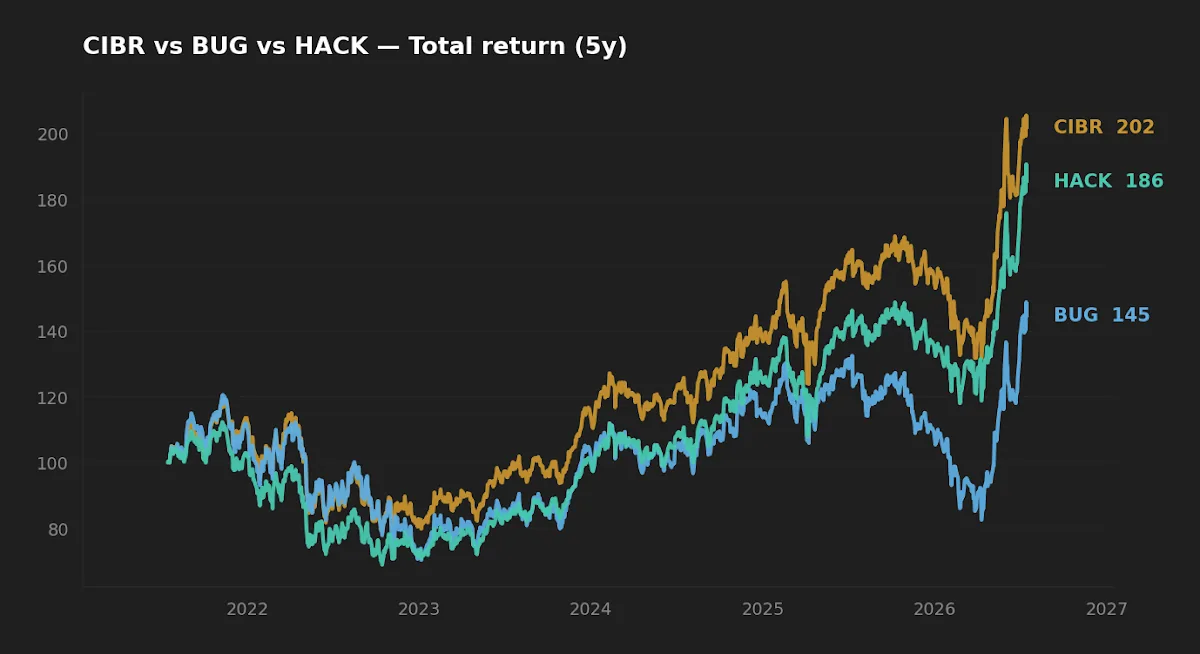
- All three funds sell the same story — pure-play cybersecurity exposure — but their five-year realized returns span a wide range (7.2% to 14.7% CAGR), and the gap has almost nothing to do with fees.
- Index construction, not the 10 bp expense spread, is the dominant variable: how each fund weights holdings and screens for "pure-play" status explains most of the divergence.
- Bottom line: CIBR offers scale and the strongest realized record; HACK is the closest all-cap equal-weight alternative; BUG is the smallest and, so far, the weakest and most volatile of the three.
Cybersecurity is one of the few thematic pitches where the underlying demand story is genuinely durable: breaches are not cyclical, regulation keeps tightening, and enterprise security budgets rarely shrink even in downturns. That makes the theme easy to sell. It does not make the three largest cybersecurity ETFs interchangeable. The central question here is narrower and more useful than "is cyber a good theme": given three funds tracking the same idea at nearly the same price, why did their realized returns diverge so sharply — and what does that tell a long-horizon investor about how to read a thematic ETF?
Context: three funds, one theme, three rulebooks
CIBR (First Trust NASDAQ Cybersecurity ETF), HACK (Amplify Cybersecurity ETF), and BUG (Global X Cybersecurity ETF) all promise concentrated exposure to companies that build and sell security software, hardware, and services. What separates them is the index rulebook. CIBR tracks a modified market-cap-weighted NASDAQ index that includes a defined cybersecurity classification. HACK follows a modified equal-weight approach that spreads capital more evenly across a smaller pure-play roster. BUG uses its own thematic index with a tilt toward companies deriving a majority of revenue from security products. Those are three different bets on the same sector, and over a five-year window the differences compounded into materially different outcomes.
This is a familiar pattern for anyone who has read our work on how index construction quietly separates funds that look identical on the label. In a broad large-cap growth sleeve the construction differences are subtle. In a concentrated thematic sleeve of 30–70 holdings, they are not subtle at all — they are the whole story.
The data
| Metric | CIBR | HACK | BUG |
|---|---|---|---|
| Issuer | First Trust | Amplify | Global X |
| Expense ratio | 0.58% | 0.60% | 0.50% |
| AUM | $13.8B | $2.6B | $1.2B |
| Inception | 2015-07-06 | 2014-11-11 | 2019-10-25 |
| Distribution yield | 0.4% | 0.1% | 0.0% |
| 5Y CAGR | 14.7% | 12.7% | 7.2% |
| 10Y CAGR | 19.0% | 17.1% | n/a |
| 5Y volatility (annualized) | 25.2% | 24.6% | 28.9% |
| 5Y max drawdown | -33.9% | -38.7% | -41.7% |
| NAV | $94.66 | $114.00 | $41.95 |
Return, volatility, and drawdown figures are from yfinance price history (adjusted for distributions), pulled 2026-07-16. Expense ratios, AUM, inception, and yield are from issuer fact sheets: First Trust (CIBR), Amplify (HACK), and Global X (BUG). Note that BUG launched in October 2019, so its "5-year" window is close to its full live history and covers a narrower set of regimes than CIBR or HACK.
The fee gap is real but almost irrelevant here
On this site the usual conclusion is that a fee gap compounds into a meaningful drag over decades, and that basis points deserve respect. That logic holds when the funds being compared are near-substitutes — two S&P 500 trackers, two total-bond giants — where a few basis points is one of the few things separating them. It does not carry the argument here.
The spread between the cheapest fund (BUG at 0.50%) and the most expensive (HACK at 0.60%) is 10 basis points. Over the same five-year window, the spread in realized annual return between the best and worst performer was roughly 750 basis points a year. The fee difference is real, and I would not wave it away — but it is swamped by an order of magnitude by what the index rules did to the portfolios. Notice, too, that the ranking runs backwards from the fee-driven intuition: BUG is the cheapest fund and delivered the lowest five-year CAGR and the deepest drawdown, while HACK carries the highest fee and sits comfortably in the middle. Cost discipline matters, but in a concentrated thematic sleeve it is a second-order term.
The fee spread across these three funds is 10 basis points; the realized return spread was roughly 750 basis points a year. In a concentrated theme, the rulebook dominates the expense ratio by an order of magnitude.
Where the construction actually bites
Two design choices explain most of the divergence. The first is weighting. A modified market-cap scheme, as CIBR uses, lets the winners run — as a handful of large security platforms compounded, the fund's weight in them grew, and the fund rode that concentration upward. An equal-weight-leaning scheme like HACK's caps that effect: it trims winners and adds to laggards at each rebalance, which dampens both the upside from a runaway leader and the downside from a single blow-up. Over a period when a few large-cap security names led, cap-weighting was rewarded. That is regime-dependent, not a permanent edge.
The second choice is the pure-play screen. BUG's index leans hard toward companies that derive the majority of revenue from cybersecurity, which sounds like the purest expression of the theme and, in practice, tilted the fund toward smaller and higher-beta names. That shows up directly in the risk numbers: BUG's 28.9% annualized volatility and -41.7% max drawdown are the highest of the three, and its return did not compensate for the extra variance. A purer thematic screen is not automatically a better one — it often just means a smaller, more volatile book with less diversification against the theme's own drawdowns. Investors reaching for the "purest" cybersecurity fund should understand they are usually also reaching for more small-cap and more single-name risk.
Realized risk: all three are volatile, and that is the point
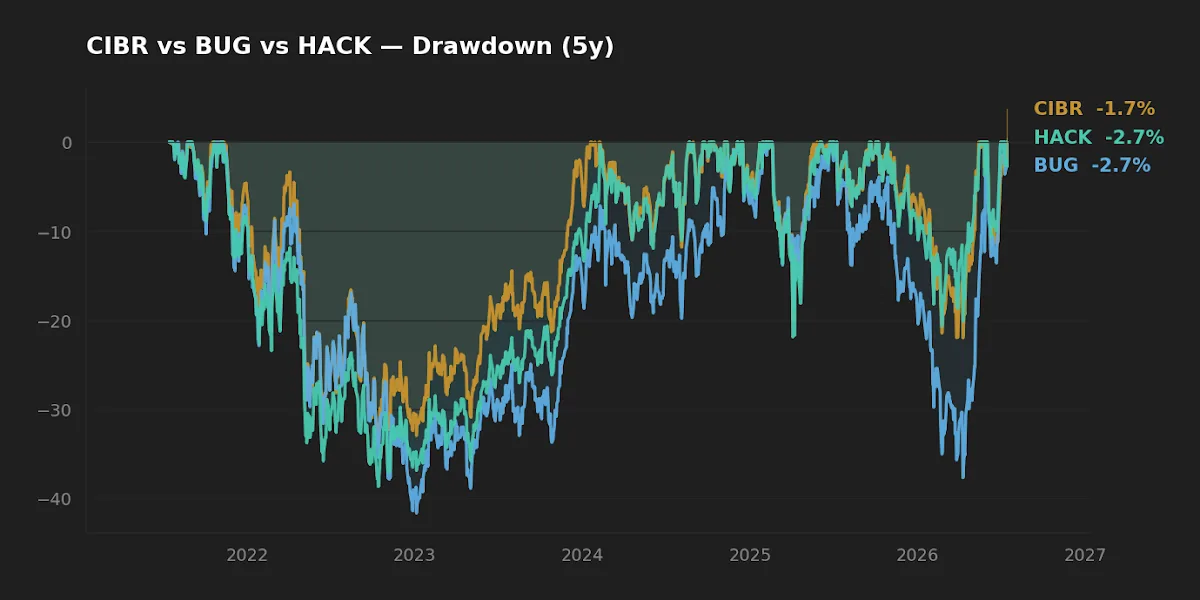
Whatever the return ranking, none of these funds is a low-volatility holding. Annualized five-year volatility runs from 24.6% (HACK) to 28.9% (BUG) — well above a broad equity index — and every one of them drew down more than a third from peak to trough during the window, with BUG touching -41.7%. That is the behavioral variable that matters most for a long-term investor, because drawdown depth and duration are where discipline breaks. A sleeve that falls 40% tests conviction in a way that a spreadsheet CAGR never conveys.
It is worth framing that against the current backdrop rather than the calm of a single snapshot. With the VIX near 16.5 and the 10-year Treasury at 4.58% (FRED, asof 2026-07-14), high-beta thematic equity is competing against a genuinely risk-free 4.58% yield. That is a higher bar than thematic funds faced in the near-zero-rate years, and it is one reason position sizing — not fund selection — is usually the more consequential decision. A concentrated, 25%-volatility theme belongs in a satellite sleeve sized so its worst plausible drawdown does not derail the plan. This is the same discipline we applied to sizing a volatile satellite against the long-term core.
Scoreboard
| Category | Winner | Why |
|---|---|---|
| Cost | BUG (0.50%) | Lowest headline fee, though the gap is only 10 bp. |
| Realized return (5Y) | CIBR (14.7%) | Cap-weighting rewarded during a large-cap-led stretch. |
| Realized risk | HACK | Lowest volatility (24.6%) of the three; shallower drawdown than BUG. |
| Scale / liquidity | CIBR ($13.8B) | Largest AUM, tightest expected spreads, lowest closure risk. |
| Suitability (satellite tilt) | Depends on view | CIBR for cap-weight momentum; HACK for equal-weight diversification. |
Frequently asked questions
Are CIBR, HACK, and BUG basically the same fund? No. They target the same theme but use different indices — CIBR modified cap-weight, HACK modified equal-weight, BUG a pure-play-tilted thematic index. Those rules produced a roughly 750 bp/year spread in five-year realized return, far larger than the 10 bp fee difference.
Why did BUG underperform despite the lowest fee? Its purer revenue screen tilted the portfolio toward smaller, higher-beta security names. That raised volatility (28.9%) and drawdown (-41.7%) without a matching return, per yfinance data pulled 2026-07-16. Cost was not the deciding factor.
Does CIBR's higher return mean it is the best choice going forward? Not necessarily. Its edge came partly from cap-weighting during a period when a few large names led. That is regime-dependent; equal-weight can outperform when leadership broadens. Past realized return is not a forecast.
Is a 0.58%–0.60% expense ratio reasonable for a cybersecurity ETF? It is typical for a narrow thematic fund and well above a broad-index fund's 0.03%–0.10%. The premium buys targeted exposure and rebalancing, but it should be weighed against holding a lower-cost broad technology fund, such as the ones compared in our VGT vs XLK piece, that already carries meaningful security weight.
How large a position makes sense? That is a personal allocation decision, but the risk data argues for treating any of these as a small satellite rather than a core holding: 25%+ annualized volatility and 34%–42% drawdowns are not core-sleeve behavior. Size the position so its worst plausible loss does not force a sale at the bottom.
Key takeaways
- The three funds share a theme but not a rulebook; index construction, not the 10 bp fee gap, drove a roughly 750 bp/year spread in five-year realized return.
- CIBR posted the strongest five-year CAGR (14.7%) and carries by far the largest AUM ($13.8B), giving it a scale and liquidity edge alongside its record.
- HACK's equal-weight lean delivered the lowest volatility (24.6%) and a shallower drawdown than BUG, at the cost of the highest headline fee (0.60%).
- BUG's purer pure-play screen produced the highest volatility (28.9%) and deepest drawdown (-41.7%) without a return payoff over its available history, which starts only in late 2019.
- All three are high-volatility, deep-drawdown holdings best suited to a deliberately sized satellite sleeve — with a 4.58% risk-free alternative available, position sizing matters more than fund selection.
Editor's read
If forced to hold one of these as a small thematic satellite, the editor leans toward CIBR — not primarily for its trailing return, which is partly a regime artifact, but for its scale, tighter expected spreads, and lower closure risk, which matter for a fund you intend to hold across cycles. HACK is the more defensible pick for an investor who specifically wants equal-weight diversification against single-name blow-ups. BUG's purer screen is intellectually appealing but has, so far, delivered more risk without more reward. The larger point stands above the ticker choice: in a concentrated theme, read the index rulebook before the expense ratio.
Holdings disclosure: The editor does not hold CIBR, HACK, or BUG at the time of writing.
What this comparison can and can't tell you
This is a five-year read on three funds, and BUG's live history barely fills that window — its record does not include a full-cycle bear market of the depth CIBR and HACK survived earlier. Trailing CAGR reflects one leadership regime (large-cap-led) and should not be extrapolated. The analysis uses realized price and distribution data, not forward earnings or holdings-level attribution, so it explains what happened without forecasting what will. Survivorship and single-regime risk both apply. Methodology: return, volatility, and drawdown computed from yfinance adjusted price history; expense ratio, AUM, inception, and yield from issuer fact sheets (First Trust, Amplify, Global X); macro figures from FRED. All data pulled 2026-07-15 to 2026-07-16; window analyzed is the trailing five years (and trailing ten years where available).
This article is for educational purposes and does not constitute personalized financial advice. See our full Disclaimer.