Photo by Markus Spiske on Unsplash
The short version
- URA and URNM express the uranium thesis through mining equity; NLR blends miners with nuclear utilities and fuel-cycle names, and that structural difference dominated realized outcomes.
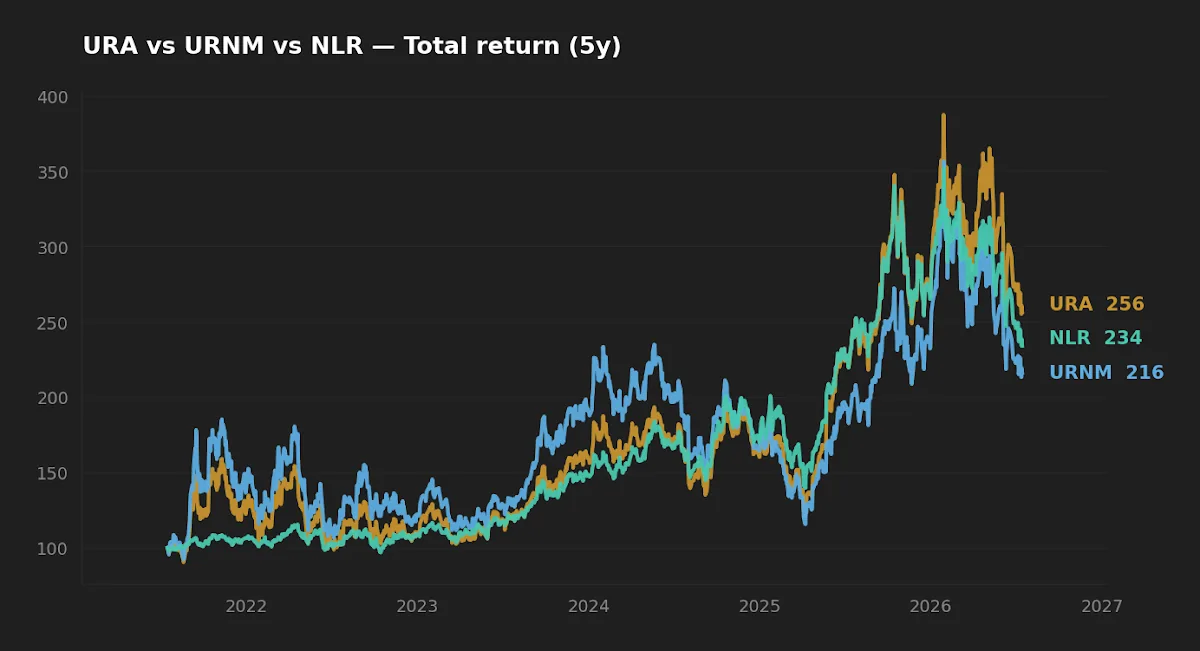
- Over five years NLR delivered nearly the same CAGR as URA (18.7% vs 19.8%) with roughly two-thirds the volatility and a much shallower drawdown — the best realized return-per-unit-risk of the three.
- Bottom line: the "purest" miner expression (URNM) was not the best-compensated one. The lower-beta wrapper captured most of the thesis with less of the pain.
The uranium trade is easy to state and hard to hold: nuclear power is being re-rated as a firm, zero-carbon complement to renewables, reactor life extensions and new builds are back on the table, and the fuel supply chain is thin. The harder question is not whether to express that view but how. Global X Uranium (URA), Sprott Uranium Miners (URNM), and VanEck Uranium and Nuclear (NLR) all sit on the same thesis, yet they package very different risk. This piece looks at what the three actually delivered over the last five years, and where the headline framing of "miners versus utilities" quietly misleads.
A 90-second orientation for readers new to the space. Uranium miners are operating-leverage plays on the uranium spot price: their earnings swing far more than the commodity, which is why miner ETFs behave like a high-beta version of the underlying story. Nuclear utilities, by contrast, are regulated cash-flow businesses that consume uranium — their fortunes track power demand and rate cycles more than spot uranium. NLR straddles both, and it also holds fuel-cycle and enrichment names, so labelling it a "utility" fund is only half right. That blend is the whole story of the numbers below.
The funds, side by side
All fund-level figures below are from yfinance price and distribution history pulled on 2026-07-16; expense ratios, AUM, and mandate come from each issuer's fact sheet. CAGR, volatility, and drawdown are computed on trailing daily total-return series.
| Metric | URA | URNM | NLR |
|---|---|---|---|
| Name | Global X Uranium | Sprott Uranium Miners | VanEck Uranium & Nuclear |
| Expense ratio | 0.69% | 0.75% | 0.52% |
| AUM | $6.0B | $1.9B | $4.2B |
| Inception | 2010-11-04 | 2019-12-03 | 2007-08-13 |
| Distribution yield | 4.8% | 3.3% | 2.7% |
| 5Y CAGR | 19.8% | 15.4% | 18.7% |
| 10Y CAGR | 15.0% | n/a* | 11.2% |
| 5Y volatility (annualized) | 43.9% | 48.6% | 29.8% |
| 5Y max drawdown | -37.9% | -50.8% | -33.5% |
*URNM launched in December 2019, so no clean ten-year series exists. Fact sheets: Global X URA, Sprott URNM, VanEck NLR.
Where the return actually came from
The naive reading of the table is that URA "won" on five-year CAGR. That reading ignores the denominator. Divide realized return by realized volatility — a crude Sharpe proxy with no risk-free adjustment — and the ordering flips: NLR sits near 0.63, URA near 0.45, and URNM near 0.32. NLR produced almost URA's return with materially less variance, and URNM produced the lowest return of the three while carrying the highest volatility. The purpose-built pure-miner fund was the worst-compensated way to hold the thesis over this window.
Why? Composition. URNM is the most concentrated in pure uranium-mining equity, which is exactly the operating-leverage exposure that amplifies both the spot rally and every correction along the way. URA dilutes that slightly with larger, more diversified names and some fuel-cycle exposure. NLR dilutes it a great deal, adding regulated utilities and enrichment businesses whose cash flows do not swing with spot uranium. The utilities are a ballast: they drag on the biggest up-legs but cushion the drawdowns, and over a full cycle that trade was worth taking. This is the same lower-variance-wins pattern seen elsewhere when a thematic sleeve is diluted with steadier cash-flow businesses — a dynamic I've written about in the context of the broader nuclear energy re-rating.
The purest expression of the uranium thesis was the worst-compensated one — URNM carried the highest volatility and delivered the lowest five-year return of the three.
Initially I expected the pure miner to lead on both return and risk, on the logic that maximum beta to a rising commodity should pay in a bull phase. The five-year data did not cooperate: the beta showed up in the volatility and the drawdown, but not proportionally in the return. That is a useful reminder that "more exposure to the story" and "more return from the story" are not the same claim.
Realized risk, and why the drawdown gap matters
The volatility numbers understate the practical difference because drawdowns are what test an investor's discipline. URNM's worst five-year peak-to-trough loss was roughly -50.8%, versus -37.9% for URA and -33.5% for NLR. A 51% drawdown requires a 104% gain to recover; a 33% drawdown requires 50%. The recovery math is convex, so the fund that falls less needs less to come back — and, just as important, is less likely to shake a long-term holder out at the bottom.
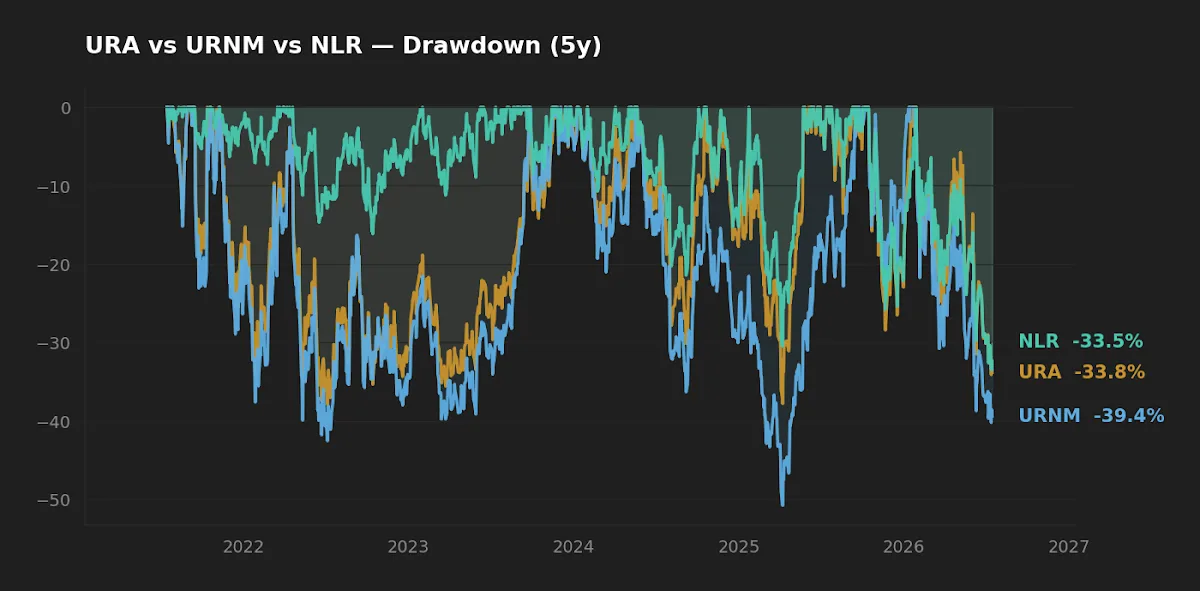
Behavior in stress is where the utility ballast in NLR earns its keep. For a sleeve you intend to hold across a full commodity cycle, the shallower drawdown is not a cosmetic difference — it is the difference between a position you can sit through and one you capitulate on. None of this makes NLR "safe." A 33% drawdown is still a severe one; this is a sector sleeve, not a core holding.
Cost, capacity, and the frictions the table hides
On headline fees, NLR is the cheapest at 0.52%, versus 0.69% for URA and 0.75% for URNM. The 0.23% gap between NLR and URNM compounds quietly over decades, though in a sector this volatile fee is a second-order concern next to composition. More relevant frictions sit below the expense ratio. URNM is the smallest at $1.9B AUM, which in a thinly traded corner of the market can mean wider bid-ask spreads and more sensitivity to flows; URA at $6.0B and NLR at $4.2B are more liquid. All three hold securities — including some smaller miners and, in URA's case, physical-uranium holding vehicles — whose own liquidity is uneven, so tracking can wander in stressed tape.
The distribution yields deserve a footnote rather than a headline. URA's 4.8% trailing yield looks striking sat next to the 4.58% ten-year Treasury (FRED, asof 2026-07-14), but a miner ETF's distribution is lumpy, largely a function of portfolio turnover and underlying corporate actions, and is in no sense a coupon. Treating it as income exposes you to the full equity drawdown for the privilege. NLR's lower 2.7% yield is the more utility-like profile, but still not a bond substitute.
The framing problem: "miners vs utilities" is not the real axis
The one thing worth carrying away is that the title's dichotomy is imperfect. NLR is not a utility fund; it is a blended uranium-and-nuclear fund that happens to include utilities. URA is not a pure miner fund; it includes fuel-cycle and physical-uranium exposure. The real axis separating these three is not miners-versus-utilities but how much operating leverage to the uranium price you are buying — highest in URNM, lowest in NLR, with URA in between. Once you frame it that way, the risk-adjusted ranking stops being surprising and starts looking like exactly what a variance-aware investor would predict. Readers comparing thematic wrappers may recognize the same "same story, different beta" problem I looked at in AIEQ vs ROBO.
| Category | Winner | Basis |
|---|---|---|
| Cost | NLR | 0.52% vs 0.69% / 0.75% |
| Realized risk | NLR | 29.8% vol, -33.5% drawdown |
| Realized return (5Y) | URA | 19.8% CAGR |
| Return per unit risk | NLR | ~0.63 CAGR/vol proxy |
| Purest thesis exposure | URNM | Concentrated miner equity |
Frequently asked questions
Is NLR just a lower-risk version of URA? Not exactly. It overlaps on the mining side but adds utilities and fuel-cycle names URA weights less heavily, so it is a structurally different portfolio that happens to have behaved like a lower-beta cousin over this window. Different composition, not a dialed-down clone.
Why did URNM lag despite being the "pure" uranium play? Over the last five years its concentration in high-beta miner equity translated into more volatility and a deeper drawdown without a proportional return payoff. Purity of exposure and quality of risk-adjusted return are separate things.
Does URA's ~4.8% yield make it an income holding? No. The distribution is lumpy and driven by portfolio activity, not a stable coupon, and it comes attached to a ~44% annualized volatility. It is not comparable to the 4.58% ten-year Treasury (FRED, asof 2026-07-14) on a risk basis.
How large a position do these justify? That is an allocation question specific to each investor, but all three are concentrated, single-theme sector sleeves with 30%+ drawdown histories. They sit on the satellite end of a portfolio, not the core.
Does the ten-year data help settle it? Only partly. URA (15.0%) and NLR (11.2%) have ten-year records; URNM launched in December 2019 and does not. Even the ten-year window is dominated by one broad uranium up-cycle, so it is thin evidence for how these behave across regimes.
What this comparison can and can't tell you
Five years is one commodity cycle, not many, and it was a broadly favorable one for the uranium narrative. These numbers describe how each fund behaved in that specific regime; they do not tell you how the miners-heavy funds would hold up in a sustained spot-uranium bear market, which the sample barely contains. URNM's short history means its risk statistics rest on the least data. And realized volatility and drawdown are backward-looking — composition, AUM, and spreads can all shift. Read the table as a description of the past, not a forecast.
Scenarios where each fund fits
A reader who wants the highest-conviction, highest-beta expression of the uranium price and can genuinely sit through a 50%+ drawdown might look hardest at URNM — with eyes open about the realized risk. A reader who wants broad exposure to the nuclear re-rating with the shallowest drawdown and lowest fee, and who is comfortable that utilities will dampen the biggest up-legs, would find NLR the most temperate expression. URA sits between the two: more return than URNM historically, more risk than NLR, and the largest, most liquid of the three.
Editor's read
If forced to hold one of these as a small satellite tilt, the editor leans toward NLR. It captured very nearly URA's five-year return with roughly two-thirds the volatility and the shallowest drawdown, at the lowest fee — the best-compensated way to own the thesis over this window, and the one least likely to shake a long-term holder out at the bottom. URNM is the cleaner story on paper, but the data says the purity was not rewarded. None of the three belongs anywhere near a core sleeve.
The editor does not hold URA, URNM, or NLR at the time of writing.
Methodology: price and total-return series, volatility, CAGR, and drawdown computed from yfinance data pulled 2026-07-16, trailing five- and ten-year daily windows. Expense ratio, AUM, inception, and mandate from each issuer's fact sheet (Global X, Sprott, VanEck). Macro figures from FRED, asof dates as cited. Volatility and drawdown are backward-looking realized statistics.
This article is for educational purposes and does not constitute personalized financial advice. See our Disclaimer.