
Photo by Pawel Czerwinski on Unsplash
The short version
- Over the trailing decade both funds compounded positively — ICLN at 9.8% and TAN at 11.1% annualized — but the last five years erased most of that story, with ICLN at −2.5% and TAN at −8.4% (yfinance, as of 2026-07-16).
- TAN's higher long-run return came bundled with a −74.0% five-year drawdown and 40.1% volatility, versus ICLN's −57.2% and 27.9%; the concentration that lifted the peak also dug the trough.
- Bottom line: ICLN is the broader, cheaper, rate-sensitive global sleeve; TAN is a levered-feeling bet on one industry's cost curve. Neither behaves like a core holding.
The central question for anyone still looking at clean-energy ETFs in 2026 is not whether the theme is real — it is how much of the 2020–2021 repricing was durable and how much was a rate-driven mirage. Two funds dominate the category, and they answer that question differently. iShares Global Clean Energy (ICLN) and Invesco Solar (TAN) both launched in 2008, both survived a full boom-bust, and both now trade far below their pandemic-era highs. What separates them is breadth, cost, and how much pain each delivered on the way down.
Context: what each fund actually owns
ICLN tracks a global clean-energy index spanning solar, wind, hydro, and the utilities and equipment makers around them, with meaningful non-US weight. TAN is narrower by design: it is a solar-industry fund, concentrated in panel manufacturers, inverter makers, installers, and a handful of downstream developers. That single distinction — diversified transition theme versus single-industry cost-curve bet — explains most of what follows in the return and risk data.
The macro backdrop matters more here than in most equity comparisons. Clean-energy project economics are financed with long-dated debt, so the sector trades with a duration-like sensitivity to rates. With the 10-year Treasury at 4.58% and the fed funds rate at 3.63% (FRED, as of 2026-07-14 and 2026-06-01), the discount rate applied to future project cash flows is far higher than it was when these funds peaked. CPI running at 3.7% year over year keeps the ceiling on how fast that reverses. A reader coming to this category expecting a clean rebound should first internalize that the headwind is structural, not sentiment.
The data
| Metric | ICLN | TAN |
|---|---|---|
| Name | iShares Global Clean Energy | Invesco Solar |
| Expense ratio | 0.39% | 0.70% |
| AUM | $2.9B | $1.7B |
| Inception | 2008-06-24 | 2008-04-15 |
| Dividend yield | 0.9% | — |
| 5Y CAGR | −2.5% | −8.4% |
| 10Y CAGR | 9.8% | 11.1% |
| 5Y volatility (annualized) | 27.9% | 40.1% |
| 5Y max drawdown | −57.2% | −74.0% |
Price and return figures are from yfinance, pulled 2026-07-16; expense ratio, AUM, and holdings characteristics are from the issuer fact sheets (iShares ICLN and Invesco TAN).
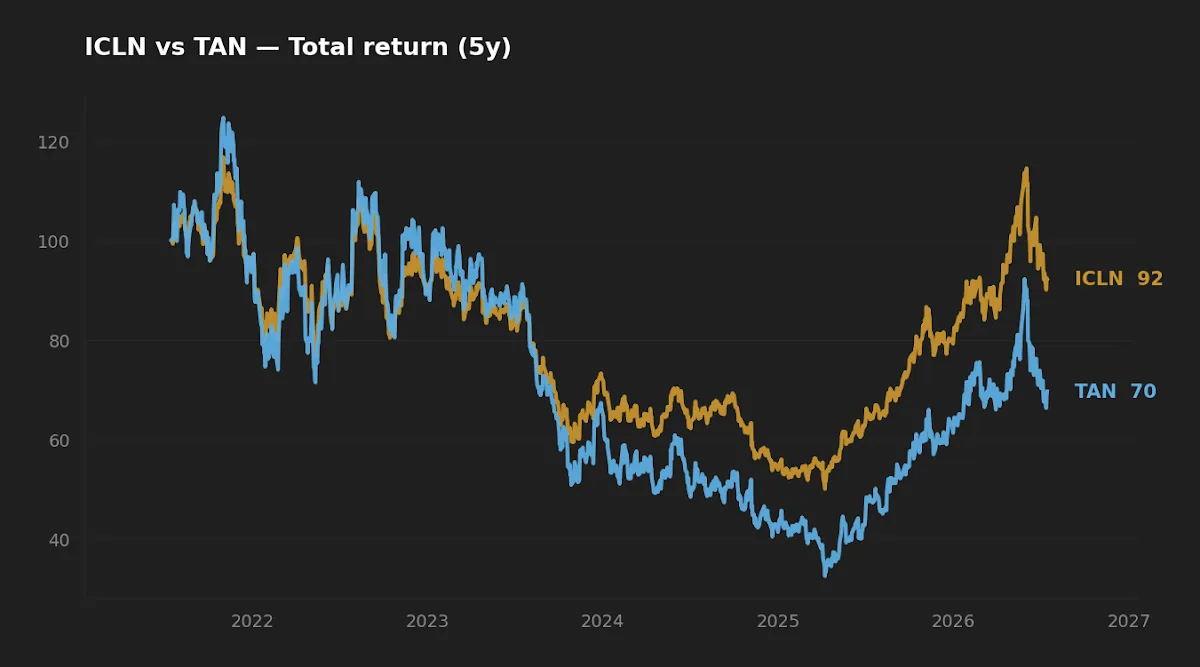
The 10-year number is doing more work than it looks
Read the table top to bottom and a tension appears immediately: TAN has the better 10-year CAGR (11.1% versus 9.8%) and the worse five-year CAGR (−8.4% versus −2.5%). Both statements are true, and reconciling them is the whole exercise.
The 10-year window still contains the 2020–2021 melt-up, when solar names re-rated on a combination of collapsing rates, policy tailwinds, and genuine cost declines. TAN, being a pure solar fund, captured that spike more completely than ICLN's diluted global basket. But a trailing CAGR is a single line drawn between two endpoints; it says nothing about the path. When the starting point of a window sits just before a once-in-a-decade repricing, the annualized figure flatters the fund. Shift the window forward five years — dropping the 2016–2020 base and keeping only the post-peak decline — and the ranking inverts hard.
This is the look-ahead and single-regime trap that the academic literature on backtesting warns about, in live form. Neither the 9.8% nor the 11.1% should be read as an expected forward return. They are descriptions of two overlapping histories, one of which happens to begin at a more flattering point.
A trailing 10-year CAGR is a line drawn between two endpoints; when the starting point sits just before a once-in-a-decade repricing, the number flatters the fund far more than the business.
Realized risk: concentration cuts both ways
The drawdown data is where the two funds separate most cleanly. Over the trailing five years ICLN fell as much as 57.2% peak to trough; TAN fell 74.0%. A −74% drawdown requires roughly a 285% gain merely to return to the prior high — a recovery-math asymmetry I have written about in the arithmetic of a −30% drawdown, and one that compounds brutally as the loss deepens. TAN's 40.1% annualized volatility against ICLN's 27.9% tells the same story at higher frequency.
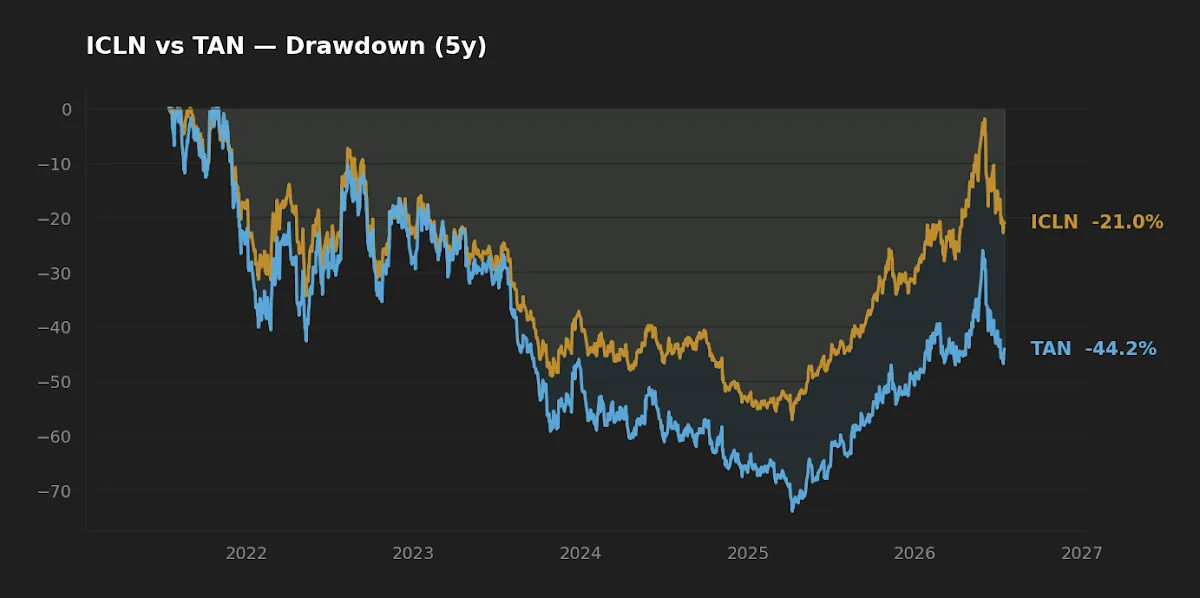
The non-obvious point is that TAN's deeper drawdown and its higher long-run return are not two facts — they are one fact seen twice. Concentration in a single industry with high operating leverage and rate-sensitive financing produces fatter tails in both directions. The same structural feature that let TAN out-compound ICLN off the 2016 base is what drove it 17 percentage points deeper into the hole after 2021. An investor who admires the 10-year number is, whether they realize it or not, signing up for the drawdown that produced it. You do not get one without the other.
Initially I expected ICLN's global diversification to buy meaningfully more downside protection than it did — a −57% drawdown is still severe. The lesson is that diversifying within a single thematic factor dampens the extremes but does not change the factor exposure. When the clean-energy trade unwinds, spreading across geographies and sub-industries helps at the margin; it does not make the position defensive.
Cost, structure, and the friction that compounds
TAN charges 0.70% against ICLN's 0.39% — a 0.31% annual gap. On a theme that has delivered negative five-year returns, paying up is a real consideration: the fee is subtracted regardless of whether the thesis works, and it compounds against you across every year of a long holding period. The 0.9% distribution yield on ICLN barely covers a fifth of its own expense ratio, and TAN currently distributes nothing, so neither fund's income offsets the drag.
Two implementation details deserve attention. First, capacity and liquidity: at $2.9B and $1.7B respectively both funds are large enough to trade at tight spreads, so bid-ask friction is a minor concern for a buy-and-hold investor. Second, tracking and turnover: thematic indices reconstitute on rules that can force concentrated funds to sell into weakness and buy into strength, which shows up as a small but persistent tracking cost. Neither is disqualifying — but on a category this volatile, the certainties (fees, structure) deserve more weight than the hopes (a rate-driven rebound).
Where the transition thesis and the portfolio meet
There is a genuine long-horizon case for energy-transition capital spending, and it is not the same as a case for these funds at today's rate structure. The distinction matters. A durable secular demand story can coexist with a decade of poor equity returns if the starting valuation and the discount rate both work against you — which is roughly the setup now. Readers interested in how energy exposure behaves under different macro drivers may find the contrast with energy equities and geopolitical conflict and with utilities in a rate-cut cycle useful, since both sit closer to the "boring, rate-sensitive, cash-generative" end of the spectrum than TAN does.
Scoreboard: winner by category
| Category | Edge | Why |
|---|---|---|
| Cost | ICLN | 0.39% vs 0.70% — a 0.31% annual gap that compounds regardless of outcome. |
| Realized risk | ICLN | Shallower drawdown (−57.2% vs −74.0%) and lower volatility (27.9% vs 40.1%). |
| Realized return (10Y) | TAN | 11.1% vs 9.8% annualized — but window-dependent and paired with the deeper drawdown. |
| Suitability as a diversified sleeve | ICLN | Global, multi-technology breadth vs single-industry concentration. |
What this comparison can and can't tell you
The five- and ten-year windows here overlap and both include exactly one boom-bust cycle. That is a single regime, not a sample of regimes, so nothing above should be read as a forecast of forward returns. The drawdown figures are realized maxima over the observed window, not a bound on future losses — a category this volatile can exceed them. And a trailing CAGR is fully hostage to its endpoints; a reader who runs the same numbers a year from now, on a different window, may see a different ranking. The data describes what happened, not what the funds will do.
Scenarios where each fund fits
Reader in their 30s, 401(k)-only, no existing thematic tilt. Neither belongs in the core. If the transition thesis is compelling to them, a small satellite position in ICLN — broader, cheaper, less path-dependent — expresses it with less single-industry risk.
Reader who wants maximum exposure to the solar cost curve specifically. TAN is the more direct instrument, but only as a small, volatility-budgeted satellite sized for a −70%-plus drawdown without forcing a sale.
Reader looking for a defensive or income sleeve. Neither fund qualifies; the near-zero yields and severe drawdowns place both firmly in the growth-satellite bucket.
FAQ
Is ICLN or TAN cheaper to hold? ICLN, at 0.39% versus TAN's 0.70% (issuer fact sheets). The 0.31% annual gap compounds against you every year regardless of performance.
Why did TAN outperform over 10 years but underperform over 5? The 10-year window still includes the 2020–2021 solar melt-up, which TAN captured more fully as a pure solar fund. The five-year window mostly captures the decline that followed. Same fund, different endpoints (yfinance, as of 2026-07-16).
Which fund is riskier? TAN, by a clear margin: 40.1% annualized volatility and a −74.0% five-year drawdown versus ICLN's 27.9% and −57.2%. Its single-industry concentration produces fatter tails in both directions.
Do these funds pay meaningful income? No. ICLN yields about 0.9% and TAN currently distributes nothing, so neither offsets its expense ratio. These are growth-oriented thematic funds, not income holdings.
Why are clean-energy ETFs so sensitive to interest rates? Their underlying projects are financed with long-dated debt, giving the sector a duration-like sensitivity. With the 10-year Treasury at 4.58% (FRED, as of 2026-07-14), the discount rate on future project cash flows is far higher than during the funds' peak.
Key takeaways
- ICLN wins on cost, realized risk, and breadth; TAN wins only on the window-dependent 10-year CAGR — and that number is inseparable from its deeper drawdown.
- TAN's −74.0% five-year drawdown and 40.1% volatility are the price of the concentration that produced its long-run outperformance. You cannot own one without the other.
- At a 4.58% 10-year Treasury, the sector's rate headwind is structural, not sentiment — a durable transition thesis can still coexist with poor equity returns.
- Neither fund behaves like a core holding; both belong, if anywhere, in a small, volatility-budgeted satellite sleeve sized to survive a −70%-plus decline without a forced sale.
Editor's read
If forced to hold one as a thematic satellite, the editor leans toward ICLN. The 0.31% fee advantage is unforgiving over decades, the drawdown and volatility are materially lower, and global multi-technology breadth reduces the single-industry fragility that gave TAN its −74% low. TAN is the sharper instrument for a specific view on solar economics, but that sharpness cuts both ways, and the higher fee is charged whether or not the view is right.
The editor does not hold either ICLN or TAN at the time of writing.
Methodology: price, return, volatility, and drawdown figures computed from yfinance daily data, pulled 2026-07-16, over trailing five- and ten-year windows. Expense ratio, AUM, inception, and holdings characteristics from the iShares and Invesco fund fact sheets. Macro figures from FRED (10-year Treasury and VIX as of 2026-07-14; fed funds rate and CPI as of 2026-06-01).
This article is for educational purposes and does not constitute personalized financial advice. See our Disclaimer.