Photo by Joachim Schnürle on Unsplash
The short version
- IJR, IWM, and VB are all called "small-cap blend," but they track three different indexes — S&P SmallCap 600, Russell 2000, and CRSP US Small Cap — and those construction rules, not stock-picking skill, explain most of the performance gap.
- The quiet driver is a profitability screen: the S&P 600 requires positive earnings to enter, IJR and VB have historically edged out IWM, and the Russell 2000's annual reconstitution carries a known implementation cost.
- Bottom line: VB is the low-cost, low-turnover default; IJR gives you the profitability gate explicitly; IWM remains the liquidity and derivatives benchmark rather than the buy-and-hold choice.
Three funds sit in almost every "best small-cap ETF" list, and on the label they look interchangeable: iShares Core S&P Small-Cap (IJR), iShares Russell 2000 (IWM), and Vanguard Small-Cap (VB), all classified as small-cap blend. The central question is not which manager is smarter — none of these is actively managed — but why three index funds covering the same asset class produce measurably different returns and drawdowns. The answer lives in index construction, and it matters because the differences compound over the decades a long-term holder actually cares about.
For readers new to the corner: "small-cap blend" means U.S. companies below the large- and mid-cap universe, held without a deliberate value or growth tilt. The complication is that "small-cap" has no single definition. Each index provider draws its own boundary, applies its own eligibility rules, and rebalances on its own schedule. IJR follows the S&P SmallCap 600. IWM follows the Russell 2000. VB follows the CRSP US Small Cap Index. Same neighborhood, three different maps — and the map decides what you own. If you want the adjacent debate on the value side, the AVUV vs VBR comparison covers where an explicit value screen changes the picture.
The data, before the narrative
All price-derived figures below are computed from adjusted-close history via yfinance, pulled 2026-07-16. Expense ratio, AUM, and inception come from issuer fact sheets: IJR, IWM, and VB.
| Metric | IJR (S&P 600) | IWM (Russell 2000) | VB (CRSP Small Cap) |
|---|---|---|---|
| Expense ratio | 0.06% | 0.19% | 0.03% |
| AUM | $111.3B | $83.0B | $188.6B |
| Dividend yield | 1.1% | 0.9% | 1.2% |
| Inception | 2000-05-22 | 2000-05-22 | 2000-11-13 |
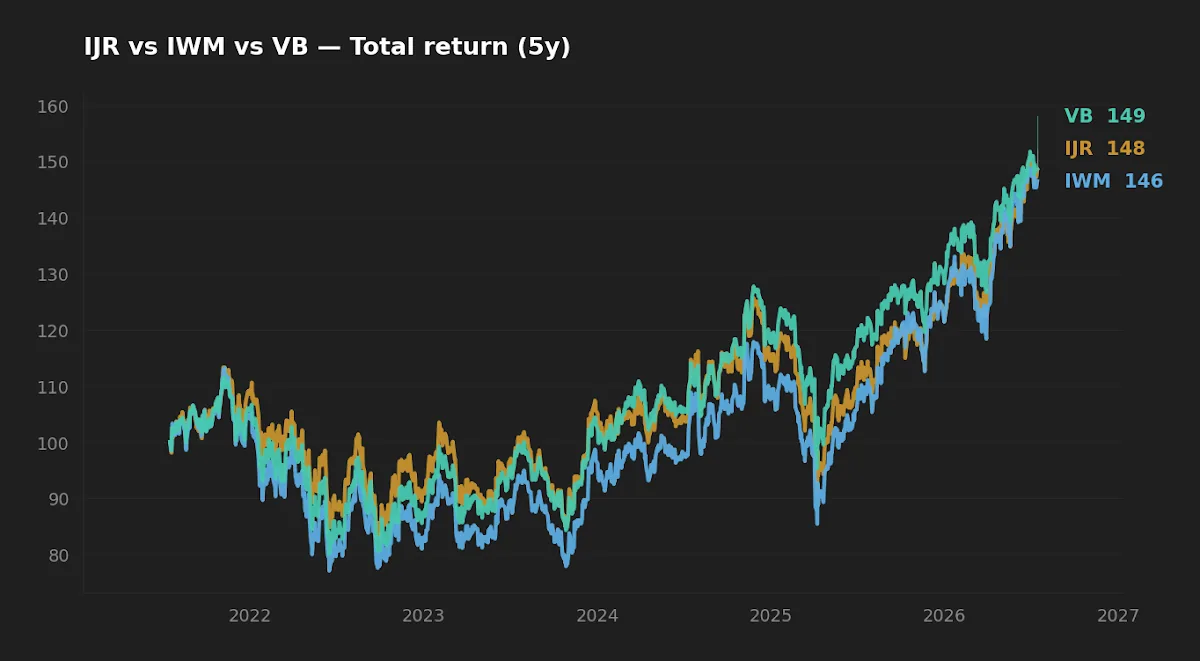
| 5Y CAGR | 7.8% | 7.3% | 7.8% |
| 10Y CAGR | 11.3% | 11.4% | 11.5% |
| 5Y volatility (annualized) | 21.4% | 22.6% | 20.8% |
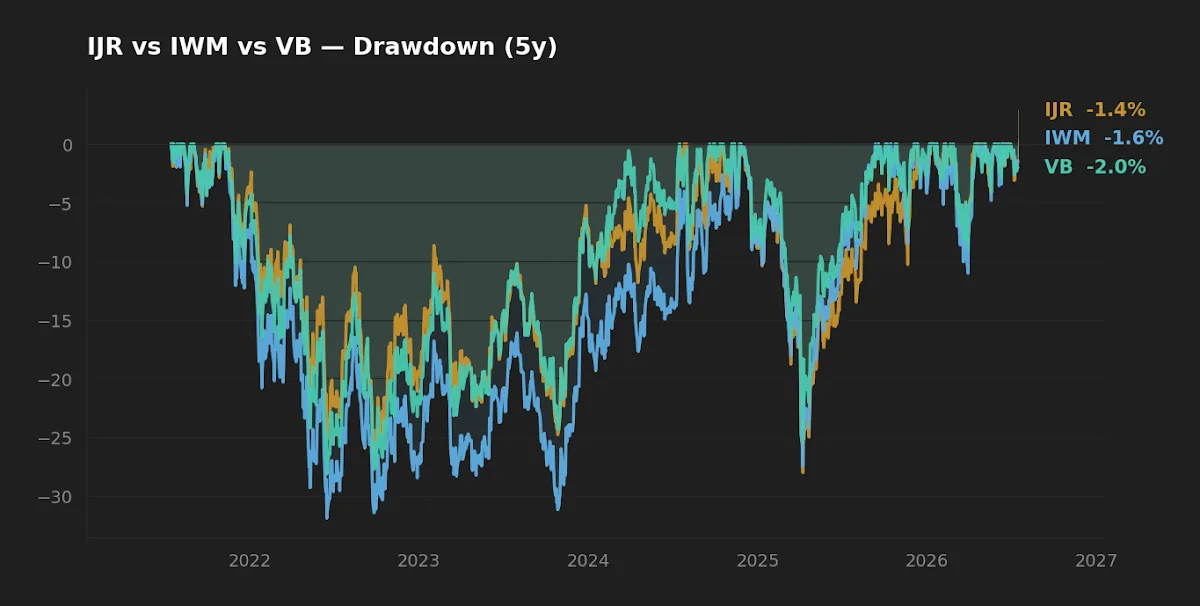
| 5Y max drawdown | -28.0% | -31.9% | -28.2% |
Why three indexes diverge
The three benchmarks disagree on three things: how many stocks to hold, where the boundary sits, and how often to redraw it.
The Russell 2000 is a rules-clean slice — it takes the 1,001st through 3,000th largest U.S. companies by market cap and reconstitutes once a year at the end of June. That mechanical clarity is also its weakness. Because the reconstitution date and methodology are public, the market anticipates which names enter and exit, and trillions of benchmarked dollars trade around the same window. The academic and practitioner literature on Russell reconstitution documents a measurable price impact from this predictability — a cost the index bears whether or not any individual investor notices it.
The S&P SmallCap 600 behind IJR takes a different route. Its committee applies an eligibility gate — most notably a requirement of positive as-reported earnings before a company can enter — and rebalances on an as-needed basis rather than one crowded annual date. Fewer names (roughly 600), a quality hurdle, and staggered turnover.
VB's CRSP US Small Cap Index is the broadest of the three, extending further up into the smaller mid-cap range and, critically, using buffer zones. Instead of forcing a stock out the moment it crosses a hard line, CRSP lets holdings drift within a band before migrating them between size indexes. That packeting reduces turnover, and lower turnover means lower transaction cost and better tax efficiency — the mechanical reason VB carries the lowest headline fee at 0.03% and a structurally cheaper trading profile underneath it.
The profitability screen nobody puts on the label
Here is the non-obvious part. The S&P SmallCap 600's positive-earnings requirement is, in factor terms, a soft profitability screen — and profitability (the "RMW" factor in the Fama-French five-factor framework) has been one of the more durable sources of small-cap outperformance in the literature. It quietly filters out a slice of the deeply unprofitable micro-cap tail that the Russell 2000 holds by default.
Initially I assumed this would show up as a clean, persistent IJR-over-IWM premium. Then I looked at the realized numbers across windows, and the story is more honest than that. Over the trailing five years IJR compounded at 7.8% versus IWM's 7.3% — consistent with the quality tilt helping. But over ten years the three funds land within a fifth of a percentage point of each other: 11.3%, 11.4%, 11.5%. The profitability edge is real in the construction, but it is regime-dependent in the outcome. It helps most when unprofitable small caps are being punished and fades when the junkiest names lead a rally. That is exactly the kind of effect a single backtest window will over- or under-sell depending on where you start it.
The label says "small-cap blend" three times; the index rulebook says quality-screened, reconstitution-exposed, and buffer-zoned — and the rulebook is what you actually own.
Realized risk, not just return
Return differences are small; the risk differences are where the indexes separate more cleanly. Over the trailing five years IWM posted the deepest drawdown at -31.9% and the highest volatility at 22.6%, while VB was shallowest at -28.2% drawdown and 20.8% volatility, with IJR close behind. That ordering is not random. VB's reach into larger, more established small caps dampens the ride, and IJR's profitability gate trims some of the fragile names that fall hardest in a stress window. IWM, holding the full 2,000-name tail including the unprofitable slice, absorbs more of the shock.
Small caps in general are the volatile end of the equity core, and the current macro backdrop is relevant to how they behave from here. With the 10-year Treasury at 4.6% and the fed funds rate at 3.6% (FRED, asof 2026-07-14 and 2026-06-01), small caps — which carry more floating-rate debt and refinance more frequently than large caps — remain more rate-sensitive than the S&P 500. That is a structural exposure, not a forecast; the same funds behaved very differently in the low-rate decade that preceded this one. The data read on small-cap behavior during the 2026 geopolitical shock is a useful companion on how this asset class moves under stress.
Cost and structure, where VB wins on paper
On pure implementation friction, the ranking is unambiguous. VB at 0.03% and IJR at 0.06% are effectively rounding errors; IWM at 0.19% is more than six times VB's fee. Over multi-decade horizons a 0.16 percentage-point gap is not trivial — it is a certain, compounding headwind subtracted before any factor bet pays off. The same discipline of watching basis points applies here as in the large-cap S&P 500 fee comparison: cost is the one variable you control with certainty.
The counterweight is why IWM still commands $83.0B despite the fee. IWM is not primarily a buy-and-hold vehicle — it is the small-cap liquidity and derivatives benchmark. Its deep options market, tight spreads, and futures ecosystem make it the tool of choice for hedging and tactical exposure. For a long-term holder, that liquidity premium is paying for a feature you likely will not use. AUM scale here signals trading utility, not suitability for the core sleeve.
Winner by category
| Category | Winner | Why |
|---|---|---|
| Cost | VB (0.03%) | Lowest fee plus buffer-zone low turnover. |
| Realized risk (5Y) | VB | Shallowest drawdown (-28.2%), lowest volatility (20.8%). |
| Realized return | Tie (10Y) | All three within 0.2 pts over 10Y; IJR led modestly over 5Y. |
| Suitability (buy-and-hold core) | VB / IJR | IWM's fee and liquidity focus fit trading, not the long-term core. |
FAQ
Are IJR, IWM, and VB redundant if I own more than one? Largely, yes. They overlap heavily in the small-cap universe, and holding two of them mostly duplicates exposure while blending their index quirks. Most portfolios need one small-cap blend position, not two.
Why does IWM charge 0.19% when VB charges 0.03%? IWM's fee reflects its role as the small-cap liquidity and derivatives benchmark rather than a cost-minimized index fund. You are paying for an ecosystem of options and futures liquidity that a long-term holder generally does not need.
Does the S&P 600 profitability screen guarantee IJR beats IWM? No. The positive-earnings gate is a quality tilt that has helped in some windows — including the trailing five years — but the ten-year returns of all three are nearly identical. The edge is regime-dependent, not guaranteed.
Is VB really "small-cap," given its mid-cap reach? VB's CRSP index extends further up the size spectrum than the S&P 600 or Russell 2000, so it holds somewhat larger companies on average. That broader reach is part of why its volatility and drawdown have been lower than IWM's.
How do these fit alongside a small-cap value fund like AVUV? These three are blend — no deliberate value tilt — so they sit in a different slot than a factor fund. The case for small-cap value patience covers when an explicit value screen is worth the added tracking error.
What this comparison can and can't tell you
The five-year window here spans one distinct regime — post-2021 rate normalization — and the ten-year figures still miss the deep low-rate decade before it. None of these numbers is a stress test against a 2008-scale small-cap collapse, and realized CAGR is path-dependent on the exact start date. The profitability screen's contribution is inferred from construction and consistent with the data, not isolated in a controlled attribution here. Treat the risk ordering (IWM deepest, VB shallowest) as more robust than the small return gaps, which are within the noise of window selection.
Scenarios where each fund fits
Reader in their 30s, 401(k)-only, wants one small-cap slice for the long-term core → VB or IJR; the low fee and lower realized drawdown favor VB, the explicit profitability gate favors IJR. Either is defensible; owning both is not.
Reader who trades options or hedges small-cap exposure tactically → IWM, for its liquidity and derivatives depth, accepting the higher fee as the cost of that utility.
Reader who specifically wants a quality tilt inside small-cap blend → IJR, for the S&P 600's positive-earnings requirement, understanding the edge varies by regime.
Editor's read
If forced to hold one small-cap blend fund in the long-term core, the editor leans toward VB: the 0.03% fee and buffer-zone construction give it the lowest structural friction of the three, and its realized drawdown and volatility have been the mildest without sacrificing return over ten years. IJR is the close and reasonable alternative for a reader who wants the profitability screen made explicit. IWM, for all its liquidity, is a trading instrument that a buy-and-hold investor is overpaying to hold.
The editor holds a small-cap blend position via a Vanguard index vehicle and does not hold IWM at the time of writing.
Methodology. Price, return, volatility, and drawdown figures were computed from adjusted-close history via yfinance, pulled 2026-07-16, over trailing 5-year and 10-year windows. Expense ratio, AUM, dividend yield, and inception dates are from issuer fact sheets (iShares for IJR and IWM, Vanguard for VB). Macro figures are from FRED, asof 2026-07-14 (10-year Treasury, VIX) and 2026-06-01 (fed funds rate, CPI). Index construction details reflect published methodology from S&P Dow Jones Indices, FTSE Russell, and CRSP.
This article is for educational purposes and does not constitute personalized financial advice. See our full Disclaimer.