Photo by Markus Spiske on Unsplash
The short version
- VO and IJH both call themselves "mid-cap," but they track different indices with different rules — the S&P MidCap 400 (IJH) applies an earnings screen and excludes every S&P 500 name; the CRSP US Mid Cap Index (VO) uses buffer bands that bleed into large and small.
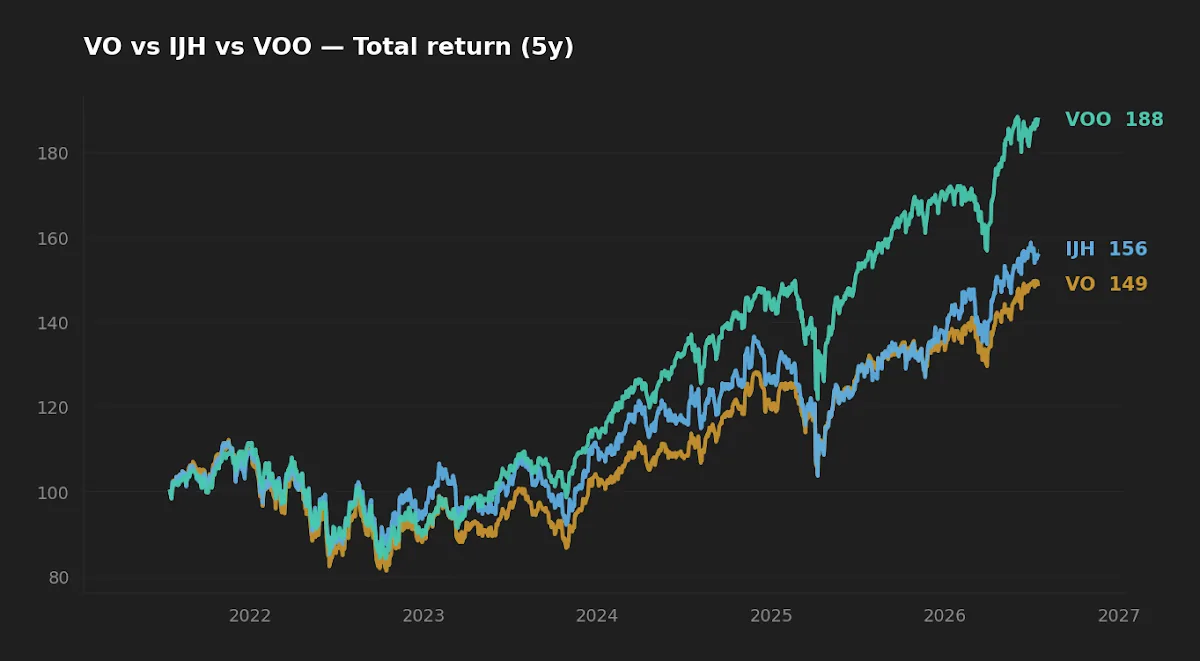
- Over the trailing five years VOO outran both mid-cap funds by roughly 450–550 basis points annualized, so the honest answer to "does mid-cap add anything to VOO?" is: not lately, and the size premium has not shown up.
- Bottom line: IJH is the cleaner mid-cap exposure and VO is the cheaper, slightly-blended one; whether either belongs beside a large-cap core is a portfolio-construction question, not a fund-picking one.
The question in the title has two layers, and most write-ups only answer the easy one. The easy layer is VO versus IJH: two large, cheap mid-cap index funds, which is "better." The harder layer — the one that actually changes a portfolio — is whether a dedicated mid-cap sleeve does anything for a holder who already owns the S&P 500 through VOO. This article works both layers with the same five- and ten-year data pulled on 2026-07-16, and it tries to be honest about what that data can and cannot settle.
Context: three funds, two different definitions of "mid"
Vanguard's VO tracks the CRSP US Mid Cap Index. iShares' IJH tracks the S&P MidCap 400. Those sound interchangeable and are not. The S&P MidCap 400 is a committee-selected index that requires positive as-reported earnings for inclusion and, by design, holds no company that sits in the S&P 500. The CRSP index is rules-based and uses "packeting" — overlapping buffer zones at the large-cap and small-cap boundaries so that a stock migrating across a size line is transitioned gradually rather than in one rebalance. The practical consequence: VO carries a thin band of stocks that a strict definition would call large- or small-cap, while IJH holds a profitability-screened middle with a hard wall against S&P 500 names.
That construction difference is the whole story of this comparison, and it matters most for the second question. Because the S&P MidCap 400 explicitly excludes S&P 500 constituents, IJH has essentially zero holdings overlap with VOO at the security level. VO, with its boundary banding, overlaps slightly more at the top edge. So if the goal of a mid-cap sleeve is to add exposure you do not already own through a large-cap core, IJH is the more surgically distinct add.
The data
| Metric | VO | IJH | VOO |
|---|---|---|---|
| Name | Vanguard Mid-Cap ETF | iShares Core S&P Mid-Cap | Vanguard S&P 500 ETF |
| Expense ratio | 0.03% | 0.05% | 0.03% |
| AUM | $224.0B | $124.3B | $1,670.9B |
| Inception | 2001-11-12 | 2000-05-22 | 2000-11-13 |
| Dividend yield | 1.3% | 1.2% | 1.1% |
| 5Y CAGR | 8.0% | 9.0% | 13.5% |
| 10Y CAGR | 11.8% | 11.4% | 15.5% |
| 5Y volatility (ann.) | 17.6% | 19.7% | 16.9% |
| 5Y max drawdown | -27.6% | -24.1% | -24.5% |
Sources: yfinance for price, return, volatility, and drawdown (window ending 2026-07-16); issuer fact sheets for expense ratio, AUM, yield, and inception — VO, IJH, and VOO. All yields are trailing and none of these are income vehicles: against a 10-year Treasury at 4.58% (FRED, asof 2026-07-14), a 1.2–1.3% distribution is a rounding detail, not a reason to own the fund.
Cost and structure: a two-basis-point gap that barely moves the needle
On headline cost, VO wins: 0.03% versus 0.05%. On a $100,000 position that is $20 a year, and faithfulness in small things is a real principle — basis points compound. But two basis points is close to the noise floor of tracking difference. Index-fund total cost is expense ratio plus tracking error plus trading friction, and at $224B (VO) and $124B (IJH) both funds are deep enough that bid-ask spreads and creation-unit efficiency are non-issues for a buy-and-hold holder. The more consequential structural fact is not the fee but the earnings screen: IJH's profitability requirement quietly tilts it toward companies with positive as-reported earnings, which is a mild quality tilt VO does not impose. Whether that helps depends entirely on the regime — it tends to matter in drawdowns and to cost a little in speculative rallies.
Realized risk: when the lower-volatility fund takes the deeper loss
Here is the one number in the table that should stop a careful reader. VO has lower five-year volatility than IJH (17.6% versus 19.7%) but a deeper five-year maximum drawdown (-27.6% versus -24.1%). If you ranked these funds by risk using annualized volatility, you would put VO ahead as the safer holding. If you ranked them by worst peak-to-trough loss, IJH comes out ahead. Both rankings are correct and they disagree.
Volatility measures how much a fund shakes day to day; drawdown measures how far it falls and how long it stays down. A fund can shake less and still fall further — ranking by one does not rank by the other.
The reconciliation is that volatility is a symmetric, high-frequency dispersion measure while maximum drawdown is a path-dependent tail statistic driven by a single worst episode. IJH's earnings screen plausibly cushioned its trough — the profitable-companies tilt is exactly the kind of quality exposure that behaves better when markets discriminate — even though its day-to-day dispersion ran higher. I went into this comparison expecting the lower-vol fund to also carry the shallower drawdown; the data did not cooperate, and that mismatch is the most useful thing in the whole exercise. It is also a caution against reducing "risk" to one number.
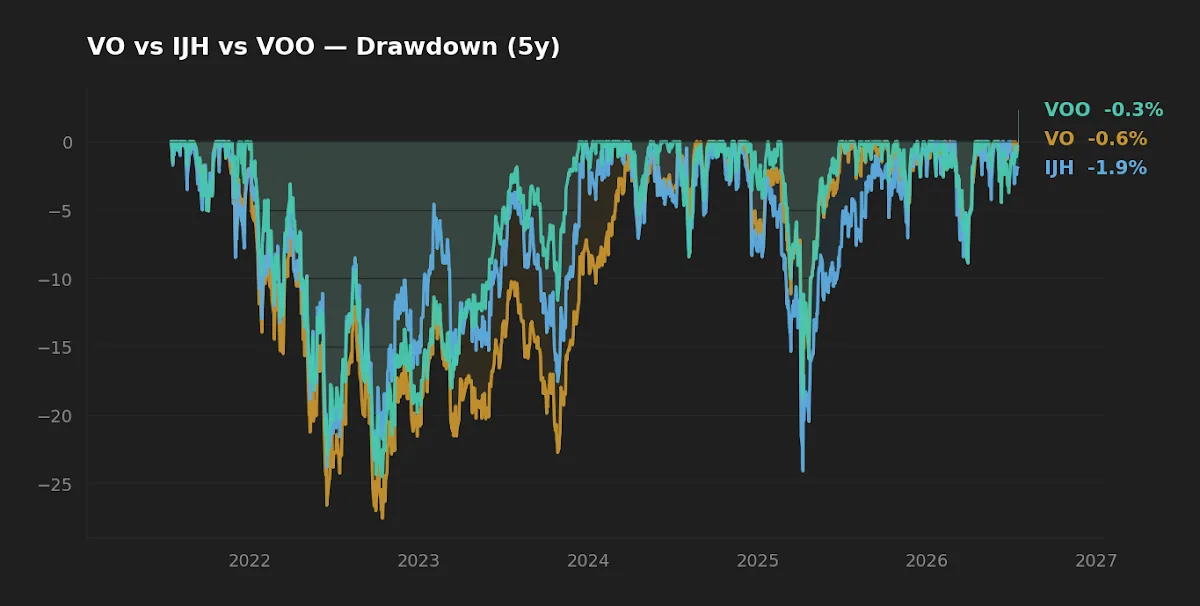
Context on the regime matters too. The VIX sat at 16.5 on 2026-07-14 (FRED) — a calm tape. Trailing five-year drawdown figures are anchored by the 2022 rate-shock decline, and none of these three funds has been stress-tested by this data against a genuine mid-cap-specific credit event. The arithmetic of recovering from a deep fall is unforgiving regardless of fund, a point worth internalizing separately; the recovery math on a -30% drawdown is the same whether you took it in large- or mid-caps.
The real question: does mid-cap add anything to a VOO core?
This is where the two-fund debate dissolves into a portfolio question. Over five years, VOO compounded at 13.5% against 8.0% for VO and 9.0% for IJH — a gap of 450 to 550 basis points a year. Over ten years the gap narrows but persists: 15.5% for VOO versus 11.8% (VO) and 11.4% (IJH). The academic case for a mid-cap allocation rests on the size factor — the long-run tendency documented in the Fama–French literature for smaller companies to earn a premium over larger ones. That premium simply has not paid over these windows. Large-cap, and specifically the top of the S&P 500, led.
Two honest caveats keep this from being a verdict. First, ten years is one regime, not a distribution of regimes; the size premium is measured over many decades, and a decade of large-cap leadership is exactly the kind of stretch that has historically preceded mean reversion — or has simply continued. The data cannot tell you which. Second, the diversification argument is real even when the return argument is not: because the S&P MidCap 400 holds no S&P 500 names, an IJH sleeve genuinely broadens the opportunity set rather than doubling down on names a VOO holder already owns. That is the same overlap logic that makes the VOO-versus-VTI question mostly about overlap measurement rather than fund quality, and it is why VTI already captures mid- and small-caps inside a single total-market wrapper — a holder choosing VTI over VOO has, in effect, already made a partial mid-cap decision without buying a separate fund.
Editor's read
Between the two mid-cap funds, the editor leans slightly toward IJH for anyone deliberately adding a mid-cap sleeve to a large-cap core: the earnings screen and the clean exclusion of S&P 500 names give it a more distinct, more intentional exposure, and the two-basis-point cost premium over VO is trivial against that. VO is the better default only if the goal is the cheapest broad mid-blend with some large/small bleed accepted. But the larger read is that the fund choice is downstream of the allocation choice — and the five- and ten-year data give no return-based reason to carve out mid-caps beside VOO. The defensible reasons are diversification and a belief in eventual size-premium mean reversion, both of which are bets on the future the backtest cannot confirm.
Scoreboard: winner by category
| Category | Edge | Why |
|---|---|---|
| Cost | VO | 0.03% vs 0.05% — small but real |
| Realized risk | Split | VO lower volatility; IJH shallower drawdown |
| Realized return | IJH (5Y), VO (10Y) | Leadership flipped across windows |
| Distinctness vs VOO | IJH | Zero S&P 500 overlap by construction |
| Suitability as a satellite | IJH | Cleaner, more intentional mid-cap exposure |
Frequently asked questions
Are VO and IJH essentially the same fund? No. They track different indices with different rules. IJH (S&P MidCap 400) applies an earnings screen and excludes S&P 500 companies; VO (CRSP US Mid Cap) uses buffer-band construction that overlaps slightly with large and small caps. The result is meaningfully different holdings at the boundaries.
Why did IJH beat VO over five years but lose over ten? Relative performance between two similar sleeves is regime-dependent. The earnings screen and different boundary definitions cause the funds to lead in different environments. A leadership flip across windows is a reason to distrust any single-window ranking, not to extrapolate it.
If I own VOO, do I need a mid-cap fund at all? You do not "need" one. The data shows VOO outperformed both over five and ten years. A mid-cap sleeve is a deliberate diversification and size-factor bet, justified by index-construction distinctness (especially IJH's zero overlap with VOO) rather than by recent returns.
Is the higher yield on VO a reason to prefer it? No. At 1.3% versus 1.2%, and against a 4.58% 10-year Treasury (FRED, asof 2026-07-14), these are total-return equity funds, not income vehicles. The distribution difference is noise.
Does the lower expense ratio make VO the clear winner? On cost alone, yes, but the two-basis-point gap is close to the tracking-difference noise floor. Construction and how the fund fits beside your existing holdings matter far more than $20 per $100,000 per year.
Key takeaways
- VO and IJH define "mid-cap" differently: IJH screens for earnings and excludes S&P 500 names; VO uses buffer bands that bleed into adjacent size segments.
- Over both five- and ten-year windows, a VOO large-cap core outperformed both mid-cap funds — the size premium did not show up in this data.
- The clearest lesson is a risk-measurement one: VO had lower volatility yet a deeper drawdown than IJH, so a single risk number can mislead.
- If a mid-cap sleeve is wanted, IJH offers the more distinct exposure versus a VOO core; VO offers the marginally cheaper broad blend.
- The allocation decision precedes the fund decision — and the case for mid-caps here rests on diversification and mean-reversion belief, not on realized return.
What this comparison can and can't tell you
It can rank realized cost, return, volatility, and drawdown over the specific five- and ten-year windows ending 2026-07-16. It cannot tell you whether the size premium will reassert, because ten years is a single regime and the premium is a multi-decade phenomenon. It has not stress-tested these funds against a mid-cap-specific credit shock, and it says nothing about tax-cost ratio in a taxable account, which would slightly favor the lower-turnover structure. Treat the rankings as description, not forecast.
Methodology
Price, total return, annualized volatility, and maximum drawdown computed from yfinance data over trailing five- and ten-year windows, pulled 2026-07-16. Expense ratio, AUM, dividend yield, and inception from issuer fact sheets (Vanguard for VO and VOO; iShares for IJH). Macro reference figures from FRED, as-of dates noted inline. Expense ratios shown in percent; returns, yields, volatility, and drawdowns in percent to one decimal.
This article is for educational purposes and does not constitute personalized financial advice. See our full Disclaimer.