
Photo by Vincent Y @USA on Unsplash
The short version
- IDV pays a materially higher distribution yield (5.5% vs 3.7%), but that gap did not translate into higher total return over five or ten years — VYMI edged it on both windows.
- The 0.43% fee gap and IDV's more concentrated, higher-beta book explain most of why the yield advantage stayed on the distribution line rather than in the compounded return.
- Bottom line: VYMI reads as the lower-cost, broader core holding for international dividend exposure; IDV is a higher-yield, higher-concentration sleeve whose appeal is narrower than its headline number suggests.
International dividend funds are usually bought for one line on the fact sheet: the yield. The question worth asking is whether that yield is a payment for owning durable cash-flow businesses abroad, or a payment for taking on concentration, cost, and currency risk that a total-return investor would rather not carry. VYMI and IDV sit on opposite ends of that trade-off, and the realized data lets us separate the two.
This matters because the headline numbers point in one direction and the compounded results point in another. IDV yields nearly two percentage points more, yet its five- and ten-year total returns trailed VYMI's. When a higher yield produces a lower total return, the difference has to show up somewhere — in fees, in drawdown behavior, or in the composition of the holdings themselves.
Context: what each fund actually owns
Both funds give a U.S.-based investor a basket of dividend-paying stocks domiciled outside the United States, and both are unhedged — you own the underlying currency exposure whether you think about it or not.
VYMI (Vanguard International High Dividend Yield Index Fund ETF) tracks a broad index of roughly 1,500 non-U.S. large- and mid-cap names screened for above-average forecast yield, spanning both developed and emerging markets. It is a wide, shallow tilt: high-yield in orientation, but diversified enough that no single holding or country dominates.
IDV (iShares International Select Dividend ETF) is narrower by design. It selects roughly 100 developed-market names on the basis of yield and dividend-persistence screens, which concentrates the book into a smaller set of higher-payout sectors — financials, utilities, materials, and telecoms — and into a handful of countries. The screen reaches for yield; the price of reaching is concentration. For readers comparing this to the more familiar domestic case, the same yield-versus-breadth tension shows up in our look at SCHD against VOO.
The data
| Metric | VYMI | IDV |
|---|---|---|
| Issuer | Vanguard | iShares (BlackRock) |
| Expense ratio | 0.07% | 0.50% |
| AUM | $20.4B | $8.0B |
| Distribution yield | 3.7% | 5.5% |
| Inception | 2016-02-25 | 2007-06-11 |
| 5Y CAGR | 13.7% | 13.0% |
| 10Y CAGR | 11.4% | 10.6% |
| 5Y volatility (annualized) | 14.9% | 15.6% |
| 5Y max drawdown | -24.1% | -29.2% |
Price and return figures are from yfinance, pulled 2026-07-16; expense ratio, AUM, and holdings composition are from the issuer fact sheets (Vanguard VYMI; iShares IDV). For context, the U.S. 10-year Treasury yielded 4.58% and CPI ran 3.7% year over year (FRED, asof 2026-07-14 and 2026-06-01 respectively) — worth holding in mind, because IDV's 5.5% distribution is only modestly above a risk-free nominal rate that itself sits near the inflation-adjusted breakeven.
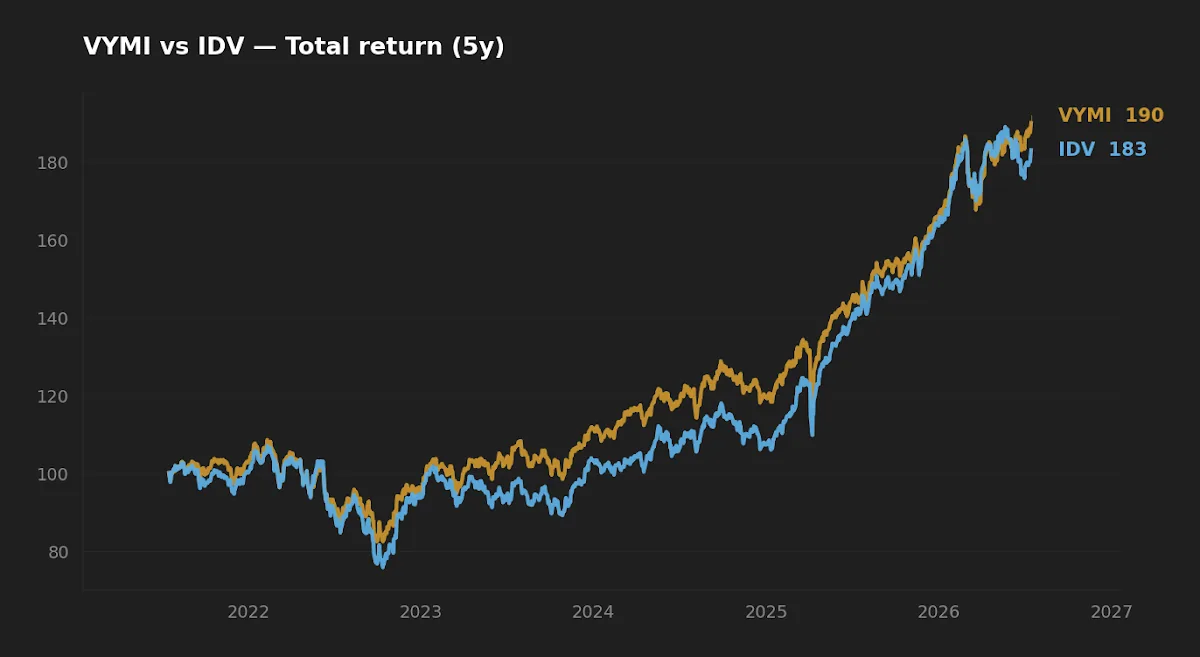
The yield gap and where it went
IDV distributes 5.5% against VYMI's 3.7% — a 1.8 percentage point advantage that, on the distribution line alone, looks decisive for an income-focused reader. Yet over the trailing five years VYMI compounded at 13.7% versus IDV's 13.0%, and over ten years at 11.4% versus 10.6%. The higher-yielding fund delivered the lower total return in both windows.
Two mechanical drags account for most of this. First, the 0.43% fee gap. A 0.50% expense ratio against 0.07% is not a rounding error over a multi-decade horizon; it is a fixed subtraction from gross return every year, compounding against the holder in the same way the yield compounds for them. Second, the composition. A yield screen that concentrates into financials and cyclically sensitive sectors tends to buy stocks whose high yield partly reflects the market pricing in lower growth or higher risk — the yield is elevated because the price is depressed. That is not automatically a flaw; value exposure has paid over long horizons. But it means IDV's yield is doing double duty as a risk signal, not purely as an income stream.
A higher distribution yield that produces a lower total return is not extra income — it is the same money, relabeled, with the risk quietly repriced onto a different line.
Initially I expected IDV's yield premium to at least partly survive into total return, on the assumption that its developed-market-only book would carry less drawdown risk than VYMI's emerging-markets slice. The realized numbers did not cooperate: IDV's five-year max drawdown was the deeper of the two. Concentration, not geography, dominated.
Realized risk
On paper, IDV's developed-market focus reads as the more defensive posture. In practice, its narrower book behaved as the riskier one. Five-year annualized volatility came in at 15.6% for IDV against 14.9% for VYMI, and — more tellingly — IDV's worst peak-to-trough drawdown reached -29.2% versus VYMI's -24.1%. A fund holding roughly 100 names weighted toward financials will move harder in a credit-sensitive selloff than one holding fifteen times as many positions across more sectors and regions.
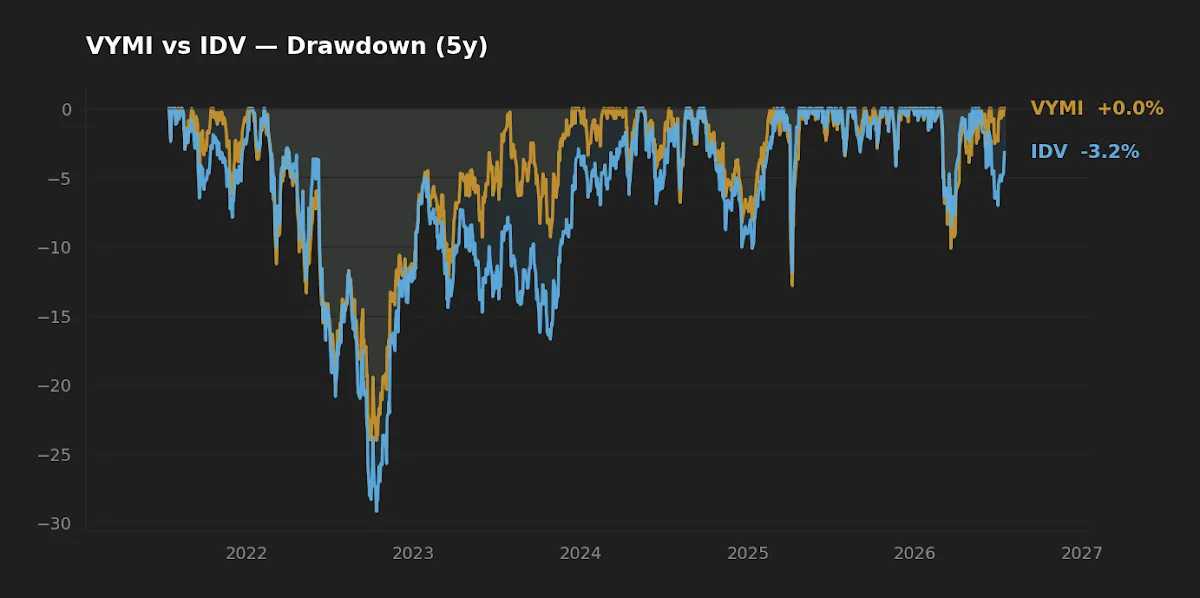
The drawdown chart is the part of this comparison a yield table cannot show you. The behavioral cost of a 29% drawdown is higher than a 24% one — not by the five-point arithmetic difference, but by whatever margin pushes a holder from uncomfortable to capitulating. For an income investor who plans to hold through cycles and spend the distributions, the depth and duration of the drawdown is the risk that actually gets tested, and here the higher-yielding fund carried the deeper hole.
The currency and tax friction most yield tables omit
Both funds are unhedged, so a U.S. investor's realized return is the local-currency return plus the move in the foreign currencies against the dollar. Over the past five years that currency term has been a swing factor in both directions; it is neither a reliable tailwind nor a hedge, and it is the reason international dividend returns can diverge sharply from what the underlying companies actually paid.
The friction that gets overlooked more often is tax. International dividends face foreign withholding tax at source. In a taxable account, U.S. investors can generally reclaim that through the foreign tax credit — an imperfect but real offset. In a tax-advantaged account (IRA, Roth), there is no U.S. tax to credit it against, so the foreign withholding becomes a pure leak with nothing to recover it. The counterintuitive implication: the higher an international fund's yield, the more withholding it drags through, and the worse the account-location mismatch bites. IDV's 5.5% yield in a Roth forfeits more reclaimable foreign tax than VYMI's 3.7% would — a cost that never appears on any fact sheet and inverts the usual "put your income in the tax shelter" instinct. The broader point about matching an asset to the right account echoes what we covered on the cash floor and SGOV: the wrapper is part of the return.
Scoreboard
| Category | Winner | Why |
|---|---|---|
| Cost | VYMI | 0.07% vs 0.50% — a 0.43% annual advantage that compounds. |
| Realized risk | VYMI | Lower volatility (14.9% vs 15.6%) and shallower drawdown (-24.1% vs -29.2%). |
| Realized return | VYMI | Higher 5Y and 10Y CAGR despite the lower yield. |
| Distribution yield | IDV | 5.5% vs 3.7% — the one clear category where IDV leads. |
| Suitability (income-now) | Depends | IDV for a taxable-account holder who genuinely needs the higher cash distribution today and can absorb deeper drawdowns. |
Frequently asked questions
Is IDV's higher yield "better" for an income investor?
Only if the goal is maximizing current cash distributions specifically, and the holder can tolerate the deeper drawdown and higher fee. For total return — reinvesting distributions and compounding — the data over five and ten years favored VYMI despite its lower yield.
Why does VYMI have higher total return with a lower yield?
Total return is price appreciation plus distributions, net of fees. VYMI's 0.43% lower expense ratio and broader, less concentrated book offset IDV's higher payout over the measured windows. Yield is one component of return, not the whole of it.
Are these funds currency-hedged?
No. Both are unhedged, so your U.S.-dollar return includes the movement of the underlying foreign currencies against the dollar. That currency term can add to or subtract from return in any given period.
Does emerging-market exposure make VYMI riskier than IDV?
It sounds like it should, but the realized numbers ran the other way: IDV, a developed-markets fund, posted higher volatility and a deeper five-year drawdown. Concentration into fewer, more cyclical sectors mattered more than the developed-versus-emerging distinction here.
Where should I hold an international dividend fund for tax efficiency?
Foreign dividend withholding is generally reclaimable via the foreign tax credit in a taxable account but not in an IRA or Roth. That argues against parking a high-yield international fund like IDV in a tax-advantaged wrapper where the credit is lost. Individual situations vary; this is a structural consideration, not personalized guidance.
What this comparison can and can't tell you
The realized window is dominated by a single broad regime: a long post-2020 recovery with generally supportive equity markets. Ten years of VYMI history barely predates its 2016 inception, and IDV's longer record spans 2007 but is not shown in full here. Neither five- nor ten-year CAGR tells you how these funds behave through a sustained dollar bull market, a European banking stress event, or a prolonged emerging-market drawdown — all plausible states not fully represented in the sample. Treat the numbers as evidence about tendencies, not as a forecast.
Scenarios where each fund fits
Reader in their 30s, 401(k)-heavy, wants international diversification and reinvests everything: the lower-cost, broader, lower-drawdown fund (VYMI) aligns with a total-return, long-horizon core.
Reader drawing income from a taxable brokerage account who values a higher current distribution and can reclaim foreign withholding: IDV's yield advantage is most defensible here, provided the deeper drawdown is understood and accepted.
Reader already holding a broad total-market international fund who wants a small high-yield tilt: a modest IDV satellite is a coherent choice; sizing it as a core holding is harder to justify given the fee and concentration.
Editor's read
If forced to choose one as a long-horizon core holding for international dividend exposure, the editor leans toward VYMI. The 0.43% fee gap is unforgiving over decades, and VYMI produced both a higher total return and a shallower drawdown while yielding nearly two points less — which tells you the yield premium in IDV was compensation for concentration and cost, not a durable edge. IDV remains defensible as a small, deliberate high-yield satellite for a taxable-account holder who specifically needs the larger current distribution, but that is a narrower case than its headline yield implies.
The editor holds neither VYMI nor IDV at the time of writing; international dividend exposure in the editor's framework is expressed through a broad total-market international position rather than a yield-screened one.
Key takeaways
- IDV's 5.5% yield beats VYMI's 3.7%, but VYMI delivered higher total return over both five and ten years — the yield gap did not survive into compounded results.
- The 0.43% fee difference and IDV's roughly 100-name, sector-concentrated book explain most of the divergence.
- IDV carried the deeper realized risk: -29.2% max drawdown versus VYMI's -24.1%, despite being developed-markets-only.
- Both funds are unhedged; currency movement is a real and unpredictable component of return.
- Account location matters — foreign withholding tax is reclaimable in taxable accounts but leaks in IRAs/Roths, which weighs against sheltering the higher-yield fund.
Methodology: Price and total-return series, volatility, and drawdown computed from yfinance daily data, pulled 2026-07-16; five- and ten-year figures use trailing windows to that date. Expense ratio, AUM, distribution yield, and holdings composition from issuer fact sheets (Vanguard, iShares) as of the same date. Macro reference figures from FRED (10-year Treasury and VIX asof 2026-07-14; Fed funds and CPI asof 2026-06-01).
This article is for educational purposes and does not constitute personalized financial advice. See our full Disclaimer.