
Photo by Jackson Sophat on Unsplash
The short version
- TTAI is not an "AI rotation" fund in any meaningful sense — it is a rules-based free-cash-flow screen on international developed-market large caps, charging 0.54% on a $31.6M asset base.
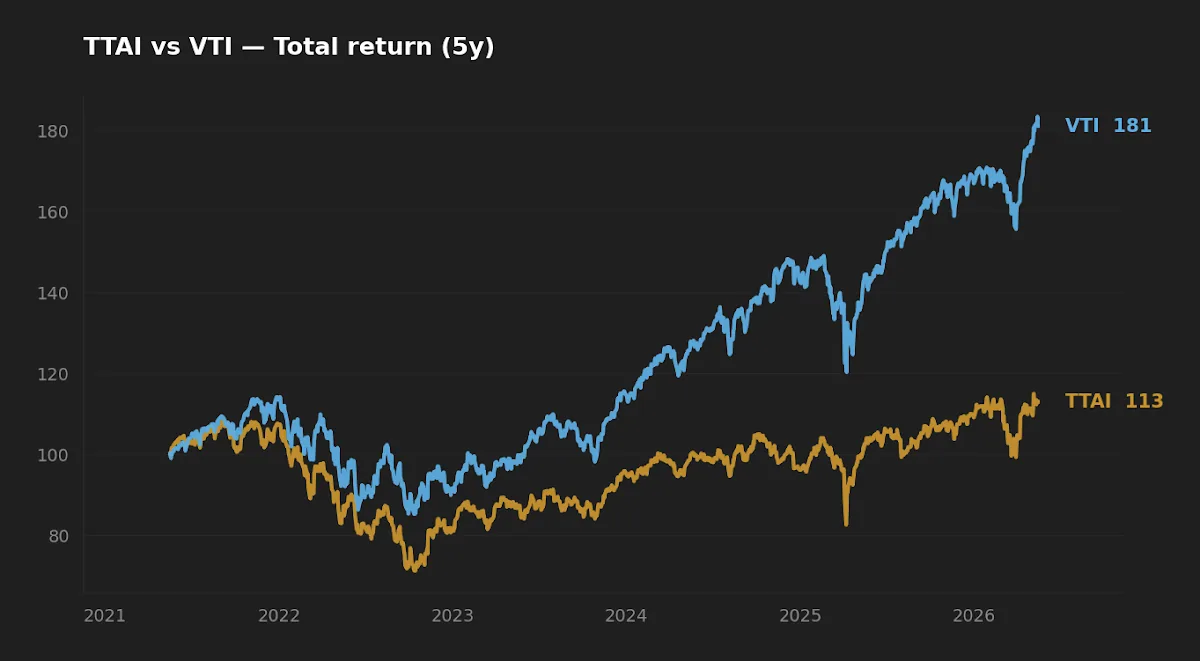
- Over the trailing five years, TTAI compounded at roughly 2.2% per year versus 12.7% for VTI; most of that gap is geography (international vs US dominance) rather than a factor verdict.
- Bottom line: TTAI is not a replacement for a broad US core like VTI. It can be considered, narrowly, as a satellite international tilt — and even then only after comparing it to plain international index ETFs that cost a tenth as much.
The most useful thing a reader can know about TTAI is what it isn't. Despite the marketing layer that has surrounded small-AUM thematic ETFs over the last several years — "AI-driven", "tactical theme rotation", "predictive signal" — the Abacus FCF International Leaders ETF is, on the actual prospectus, a rules-based free-cash-flow screen applied to international developed-market large caps. The question worth answering is whether that mandate, stripped of the marketing, has earned a place alongside (or instead of) a broad equity holding like VTI.
The short answer over the trailing five years is no — but the more interesting answer is why no, and what would have to change for the answer to flip.
Context: what these two funds actually do
TTAI launched in June 2017. It tracks an FCF-leaders index that screens international developed-market large caps for free-cash-flow yield and quality, rebalances on a defined schedule, and holds the resulting portfolio with no discretionary overlay. AUM was approximately $31.6M as of mid-May 2026, which places it well below the threshold at which most institutional allocators will even open a position. The expense ratio is 0.54%.
VTI is the reference point in this comparison only because it appears in the original title pairing — it is not a true peer. VTI is a cap-weighted total-US-market index ETF with an expense ratio of 0.03% and AUM of roughly $2.2 trillion. It contains over 3,500 holdings and is one of the most liquid equity instruments in the world. A more like-for-like benchmark for TTAI would be a plain international developed-markets index ETF, and that distinction is going to matter when we look at the return gap.
So what is being compared here is really three things at once: a small-AUM boutique strategy versus a mega-AUM index core, an international developed-market sleeve versus a US total-market sleeve, and a free-cash-flow factor screen versus a cap-weighted construction. Lumping all three differences into a single TTAI-vs-VTI verdict is exactly the kind of analysis that produces wrong conclusions.
The data
| Metric | TTAI | VTI |
|---|---|---|
| Issuer | Abacus ETFs | Vanguard |
| Fund name | Abacus FCF International Leaders ETF | Vanguard Total Stock Market Index Fund ETF |
| Inception | 2017-06-27 | 2000-11-13 |
| Expense ratio | 0.54% | 0.03% |
| AUM | $31.6M | $2,202.6B |
| NAV (2026-05-16) | $31.91 | $362.68 |
| Distribution yield | 2.3% | 1.1% |
| 5Y CAGR | 2.2% | 12.7% |
| 10Y CAGR | n/a (sub-10Y track record) | 15.0% |
| 5Y annualized vol | 16.7% | 17.4% |
| 5Y max drawdown | −34.1% | −25.4% |
Source: yfinance price/return series fetched 2026-05-16; expense ratio, AUM, and methodology from the Abacus ETFs TTAI fact sheet and the Vanguard VTI profile. Macro reference points: 10Y Treasury 4.47%, CPI YoY 3.9% (FRED, asof 2026-05-14 and 2026-04-01 respectively).
What TTAI actually is — and isn't
The legacy "AI signal" framing around tickers in this corner of the ETF universe is mostly marketing residue. Read the prospectus and the methodology document for TTAI's underlying index, and what is described is a quantitative screen: rank developed-market large caps by free-cash-flow yield, apply quality and liquidity filters, weight the survivors, rebalance on schedule. There is no machine-learning regime model, no rotation between sectors based on predictive signals, no discretionary tactical overlay. It is a factor portfolio with a defined recipe.
This matters because it sets the right expectation. A free-cash-flow screen is a value-adjacent factor — it tends to favor cash-generative, lower-multiple businesses and to underweight high-multiple growth. In a period when international developed markets in aggregate trailed the US, and within that universe the highest-multiple US growth names did most of the work, an FCF-international fund had two structural headwinds, not one. That is the lens through which the next section should be read.
The five-year return gap — how much is geography, how much is factor?
VTI compounded at 12.7% annualized over the trailing five years. TTAI compounded at 2.2%. The headline gap is roughly 10.5 percentage points per year, and over five years that turns $10,000 into about $18,200 for VTI versus about $11,100 for TTAI. As a single number it looks like a damning verdict on the fund.
But broad international developed-market indices over the same window returned in the mid-single digits annualized — well below VTI, well above TTAI. That decomposition matters: the larger share of TTAI's shortfall is the geography decision (international, when the US dominated), and a smaller share is the factor decision (FCF screen, in a period that rewarded high-multiple growth). Lumping the two into a TTAI-vs-VTI verdict effectively asks the fund to apologize for not being a US index, which it never claimed to be.
The honest evaluation is the one TTAI has not gotten in most retail coverage: how does it compare to a plain international index ETF over the same five years? On that comparison the gap narrows materially, and the FCF factor's small contribution — positive or negative — becomes the actual question, not the geography.
Most of TTAI's five-year shortfall against VTI is not a verdict on the FCF factor; it is a verdict on owning international developed markets while the US dominated the cycle.
Realized risk: more drawdown, similar volatility
Five-year annualized volatility is 16.7% for TTAI and 17.4% for VTI — close enough that "TTAI is less volatile" is not a clean claim. The more telling number is maximum drawdown: TTAI drew down 34.1% at its worst point in the window, against 25.4% for VTI. A more concentrated portfolio of international developed-market names with a value tilt experienced a deeper trough even though its day-to-day volatility was slightly lower.
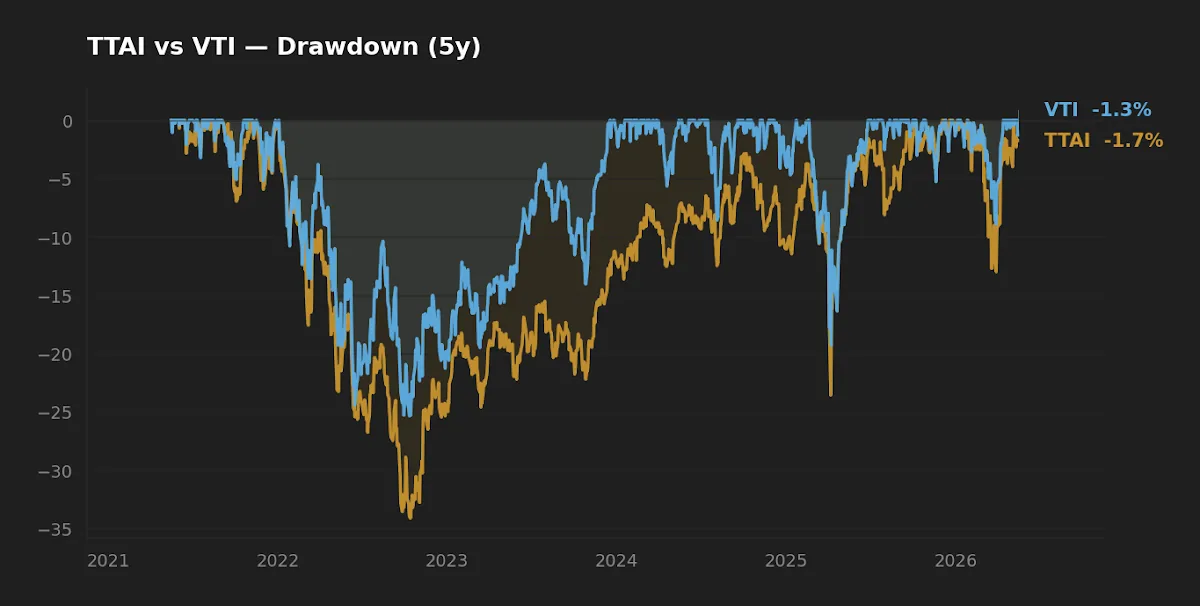
This is the pattern factor literature would predict: lower-vol holdings can still produce deeper drawdowns when the regime turns hostile to the factor, because drawdown is a path-dependent measure that compounds adverse moves. For an investor whose stress test is "how does this position behave when global growth wobbles?", the right number is the drawdown, not the standard deviation.
Cost, scale, and implementation friction
The 51-basis-point fee gap compounds. On a 30-year horizon, 51 bp per year on a $50,000 allocation costs roughly $20,000 in foregone terminal value at an 8% gross return — a non-trivial drag for an investor whose total expected excess return from the factor tilt is itself uncertain.
The scale gap is the more underappreciated friction. At $31.6M AUM, TTAI sits in the band where bid-ask spread is wide, market depth is shallow, and closure risk is a real consideration over a multi-decade holding period. ETF closure does not destroy capital — investors are made whole at NAV — but it does force a taxable event in a taxable account, and the timing is not the investor's choice. The historical base rate for ETF closures below $50M AUM is materially higher than for funds above $500M, and that is a cost any thesis on TTAI has to either accept or hedge against.
VTI faces neither of these frictions. Its expense ratio is 0.03%, its bid-ask is effectively negligible at retail size, and the probability of Vanguard closing its flagship total-market ETF inside a long investor's holding period is, for practical purposes, zero.
The "AI signal" question: is it repeatable here?
Returning to the title's question — is the "AI signal" repeatable? — the honest answer is that it is the wrong question for this fund. TTAI does not implement an AI-driven signal in any meaningful sense. It implements an FCF-yield-and-quality rules-based screen. The repeatability question for TTAI is the repeatability question for the FCF factor itself: does free-cash-flow yield, applied to international developed-market large caps, deliver a persistent risk-adjusted premium over a sufficiently long horizon? The academic literature on quality and value factors offers a measured "yes, on average, across long samples, with significant cycle-to-cycle variation." That is a different statement from "TTAI's last five years are the right test."
For readers interested in the broader question of whether quant-style ETF strategies repeat their backtest, our piece on why factor investing still works walks through the Fama-French framing and the live-vs-backtest gap in more detail. The companion analysis on VUG vs. TTAI looks at the other end of the factor spectrum.
At-a-glance scoreboard
| Category | Winner | Margin |
|---|---|---|
| Cost | VTI | Material — 51 bp |
| Realized 5Y return | VTI | Very large — 10.5 pp/yr |
| Realized 5Y drawdown | VTI | Material — 8.7 pp shallower |
| Scale / closure risk | VTI | Decisive |
| International factor exposure | TTAI | By construction — VTI has none |
| Suitability for long-term core | VTI | Strong |
What this comparison can and can't tell you
The five-year window covers a single regime in which US large-cap growth led the world and international developed markets lagged. It does not include a full international-leadership cycle of the kind seen in 2002–2007. Applying the TTAI-vs-VTI ratio observed in this window as a forward expectation overweights one regime. TTAI's live track record is also still short of a full credit-driven international downturn — it has lived through COVID and 2022, but not through a sustained dollar-weakening cycle that would historically favor its sleeve. Treat any verdict on TTAI here as conditional, not final.
Scenarios where each fund actually fits
- Reader with no international exposure, building a long-term core — VTI is reasonable for the US sleeve, but TTAI is not the natural way to add international. A plain international index ETF (broad developed or all-world ex-US) at single-digit basis points is the lower-friction starting point.
- Reader who already holds broad international and wants an FCF-quality tilt — TTAI is at least mandate-coherent here. The fee and scale are still issues; sizing should be small (single-digit % of total equity) until AUM trends meaningfully upward.
- Reader looking for an "AI rotation" fund — TTAI is the wrong instrument. Whatever marketing has been attached to the ticker, the actual portfolio is a factor screen, not a regime model.
- Reader replacing VTI — neither this article nor the data supports it. VTI's role as a low-cost broad US core is not what TTAI is built to do.
FAQ
Is TTAI actually an AI-driven fund? No, in any meaningful sense. The underlying index methodology is a rules-based free-cash-flow-and-quality screen on international developed-market large caps. There is no machine-learning model, no regime-rotation engine, and no discretionary overlay.
Why did TTAI underperform VTI by so much over five years? Two reasons. First, the fund holds international developed-market equities, and that asset class trailed US large caps materially over the window. Second, TTAI's FCF tilt skews away from the high-multiple growth names that led the global rally. Most of the gap is the first reason, not the second.
Is TTAI's $31.6M AUM a real risk? It is a real consideration. Funds at this size carry wider bid-ask spreads, shallower depth, and a higher base-rate probability of closure relative to flagship index ETFs. Closure does not destroy capital but forces an unscheduled taxable event in a taxable account.
How should I think about the 0.54% expense ratio? The right benchmark is what a plain international developed-market index ETF charges (single-digit basis points). The fee differential is the price of the FCF factor screen. Whether that screen earns its keep depends on long-run factor persistence, not on the last five years.
Does the macro setup change the read? Somewhat. With the 10-year Treasury at 4.47% and CPI year-over-year at 3.9% (FRED, asof 2026-05-14 and 2026-04-01), TTAI's 2.2% nominal 5Y CAGR has been a negative real return. A regime change favoring international developed markets and value-adjacent factors would alter the forward picture, but it is not visible in the realized data yet.
Key takeaways
- TTAI is a rules-based FCF screen on international developed-market large caps, not an AI rotation fund. Treat the marketing layer as separate from the mandate.
- The headline 5-year return gap versus VTI is mostly the geography decision, with a smaller share attributable to the FCF factor's underperformance in this regime.
- TTAI's 34.1% drawdown is deeper than VTI's 25.4% despite a slightly lower volatility — a reminder that drawdown and volatility measure different things.
- At $31.6M AUM and 0.54% expense ratio, implementation friction (bid-ask, closure risk, fee drag) is non-trivial.
- VTI remains the more defensible long-term core; TTAI is at most a small satellite tilt for an investor who already has broad international exposure and wants an FCF overlay.
Editor's read
If forced to choose between these two for a long-term core, the editor leans toward VTI without much hesitation — not because TTAI is a bad fund on its own terms, but because TTAI is not the kind of fund a core position is built from. The right peer test for TTAI is a plain international developed-markets index ETF over a longer window, not a US total-market ETF over five years. Until that test is run on a regime that includes international leadership, the fund's case is best treated as theoretical rather than evidenced.
Editor's holdings disclosure: the editor does not hold TTAI. Broad US index exposure of the kind VTI represents is part of the editor's long-term core allocation; the specific instrument used is not disclosed.
Methodology: price and return series via yfinance, pulled 2026-05-16; five-year CAGR, volatility, and maximum drawdown computed on daily total-return series over the trailing five years. Expense ratio, AUM, and fund construction sourced from the Abacus ETFs TTAI fact sheet and the Vanguard VTI profile (issuer pages linked above). Macro reference points (10Y Treasury, CPI YoY) from FRED. Comparisons are point-in-time; factor and regime conditions change.
This article is for educational purposes and does not constitute personalized financial advice. See the full Disclaimer.