The short version
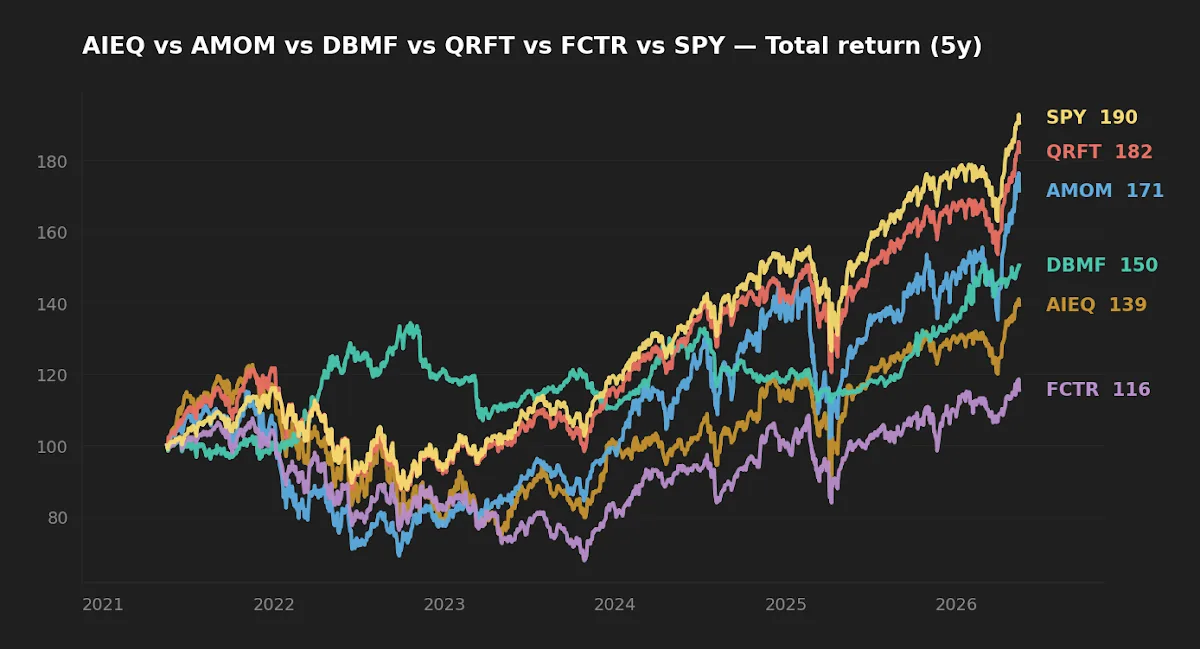
- Across the full live track record (5Y through May 2026), none of the five AI-quant or rules-based factor ETFs in this review beat SPY's 13.8% CAGR.
- The closest contender, QRFT (12.6% CAGR), trailed by 126 bp/year — and 66 bp of that gap is just the fee difference compounding.
- The most interesting result is DBMF: lower return than SPY, but realized volatility of 12.6% vs SPY's 17.1% and a max drawdown roughly half as deep. Rules-based managed futures did what AI-equity didn't — actually change the risk profile.
When marketing leans on "AI" as a differentiator, the relevant question for a long-horizon investor isn't whether the algorithm sounds clever. It's whether several years of live capital have produced a measurable edge over a 9.45 bp index fund. Across the five AI-branded and rules-based factor ETFs in this review, the honest answer is: no, not yet — and the realized risk profile makes the gap worse than the headline CAGR alone suggests.
Context: what's actually in this comparison
The five non-SPY funds are commonly lumped under the "AI ETF" or "quant ETF" label, but they differ meaningfully in construction:
- AIEQ (Amplify AI Powered Equity ETF) uses IBM Watson natural-language inputs to drive an actively-managed U.S. equity portfolio. Live since October 2017 — the longest live track record in the group.
- AMOM and QRFT (both QRAFT) apply machine-learning techniques to factor exposures: AMOM is large-cap momentum, QRFT is broad large-cap. Both launched May 2019.
- FCTR (First Trust Lunt U.S. Factor Rotation) is rules-based rather than AI — it rotates between four factor sleeves using a relative-strength signal. Included here as a non-AI quant control. Live since July 2018.
- DBMF (iMGP DBi Managed Futures Strategy) replicates the top managed-futures hedge funds through a regression on their reported returns. Not equity, and not "AI" in the LLM sense, but firmly systematic. Live since May 2019.
- SPY is the benchmark — 0.0945% expense ratio, 33-year live history.
All five challenger funds have at least 6.5 years of live operation, so the 5-year window through May 2026 captures their full operational history under the 2021 rally, the 2022 drawdown, and the 2023-2025 recovery. That is a more honest read than the rolling 12-month figures that dominate fund-marketing materials.
The numbers
| Ticker | Expense ratio | AUM | Yield | 5Y CAGR | 5Y vol | Max DD (5Y) |
|---|---|---|---|---|---|---|
| AIEQ | 0.75% | $0.12B | 0.4% | 6.8% | 22.4% | −39.0% |
| AMOM | 0.75% | $0.03B | 0.1% | 11.3% | 23.7% | −40.0% |
| DBMF | 0.85% | $3.54B | 5.2% | 8.8% | 12.6% | −20.4% |
| QRFT | 0.75% | $0.01B | 0.3% | 12.6% | 17.4% | −28.2% |
| FCTR | 0.65% | $0.05B | 0.4% | 3.0% | 19.5% | −37.1% |
| SPY | 0.0945% | $735.1B | 1.0% | 13.8% | 17.1% | −24.5% |
Source: yfinance, fetched 2026-05-16. Expense ratio, AUM, inception, and methodology cross-checked against each issuer's fact sheet (Amplify ETFs, QRAFT Technologies, iMGP DBi, First Trust, State Street SPDR).
Return: SPY held the lead the entire window
The headline number is straightforward. SPY compounded at 13.8% per year over the five years to May 2026. The best performer in the AI-quant group, QRFT, returned 12.6% — a 126 bp annual gap. The expense ratio difference alone (0.75% on QRFT vs 0.0945% on SPY) accounts for roughly 66 bp of that 126 bp gap. The other 60 bp is selection drag: the AI-driven security selection did not produce a gross-of-fee edge sufficient to overcome the fee.
AIEQ, with the longest live track record of the five, compounded at 6.8% — about half of SPY. FCTR, the rules-based factor rotator, returned 3.0% and barely beat short-term Treasuries. AMOM cleared 11.3% but with realized volatility (23.7%) materially higher than SPY's. Only DBMF, the managed-futures replicator, produced a result worth thinking about — not because of the headline 8.8% return, but because of how it got there.
Realized risk: AI-equity didn't reduce volatility, it amplified it
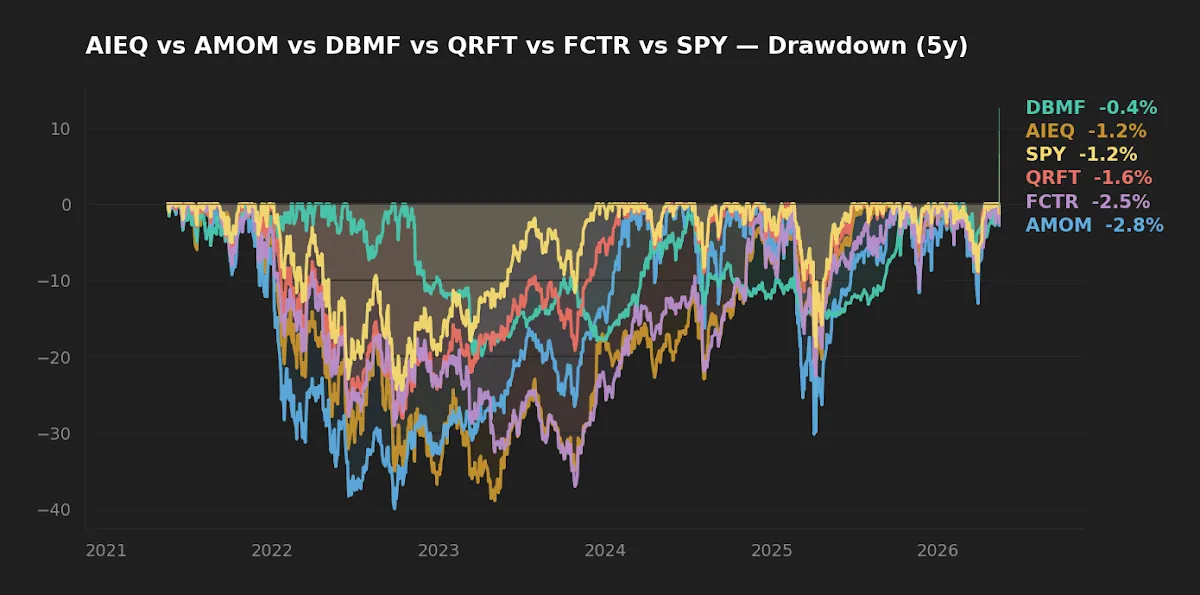
This is the part most fund-marketing decks gloss over. "AI" is implicitly sold as a smarter risk manager — an algorithm that should, in principle, sidestep some of what a passive index endures. The five-year data says the opposite happened:
- Four of the five challenger funds had higher realized volatility than SPY's 17.1%.
- Four of the five had a deeper max drawdown than SPY's −24.5%. AMOM (−40.0%) and AIEQ (−39.0%) gave back substantially more in 2022 than the index did, and recovered more slowly afterwards.
- FCTR's −37.1% drawdown is especially hard to explain for a fund whose entire premise is rotating to whichever factor is currently winning. It rotated into the wrong factor at the wrong time.
Using a rough risk-free proxy of 3.6% (the effective fed funds rate, per FRED, asof 2026-04-01), the implied Sharpe-like ratios over the five-year window are SPY ≈ 0.60, QRFT ≈ 0.52, DBMF ≈ 0.41, AMOM ≈ 0.32, AIEQ ≈ 0.14, and FCTR slightly negative. The only fund in the group whose risk-adjusted profile is distinctly different from a cheap index fund is DBMF — and DBMF is not "AI" in any meaningful sense. It's a regression-based replication of an established hedge-fund category.
The AI-quant equity funds did not produce a different risk profile from the S&P 500. They produced the same equity risk, plus an extra 56-76 bp of fee, with lower returns.
Fee math and the AUM signal
The five-year fee gap between SPY (0.0945%) and the AI-quant group (0.65-0.85%) is 56 to 76 bp per year. On a 30-year horizon at 8% gross compounding, a 65 bp annual fee drag on a $10,000 starting position costs roughly $17,000 in terminal value relative to a 10 bp benchmark fund. For a long-horizon investor, fees are not a rounding error.
The AUM signal is the second warning. QRFT, the best-performing AI fund in the table, manages only $14.9 million. AMOM manages $30.5 million. AIEQ — the most-marketed name in the category — sits at $119 million after more than eight years live. For context, SPY adds more than AIEQ's entire AUM in a single quiet trading day. Funds at that scale carry real closure risk: if AUM stays this low, the issuer's economics don't support keeping them open indefinitely. A long-horizon position in a sub-$50M fund is a fundamentally different decision from a position in a $735B index fund. The capacity discussion cuts both ways — these funds are not too big to deliver alpha; they are arguably too small to survive.
DBMF is the exception. At $3.5 billion in AUM, it is a legitimately scaled vehicle. Whether its replication approach continues to track managed futures cleanly is a separate question, but the closure risk is in a different category from the equity-AI funds.
What "AI" actually delivered, by ticker
The broader literature on machine-learning techniques in asset management — see our earlier discussion of Fama-French models in the AI era — has been consistent: ML methods can fit factor exposures better than older techniques in-sample, but post-cost edge over passive benchmarks in live trading remains hard to demonstrate. This five-year cut is one more data point in that direction. None of the AI-equity funds produced a Sharpe-like ratio meaningfully different from the underlying equity beta they're loaded on.
QRFT is the most "neutral" of the group — it tracks broadly with large-cap equity, gave back roughly a fee's worth of return, and didn't blow up the risk profile. AMOM did the opposite: it amplified volatility without delivering compensating return. AIEQ has the longest live sample and the weakest result. FCTR is the cleanest indictment in the table of mechanical factor rotation in the post-2020 regime — it didn't work. For an investor who had previously considered the AI-quant case, our earlier VOO vs AMOM analysis drew a similar conclusion; the additional year of data here only reinforces it.
At-a-glance scoreboard
| Category | Winner | Margin |
|---|---|---|
| Cost | SPY | Decisive — 56-76 bp vs the group |
| 5Y return | SPY | Material — 126 bp/yr over the best AI fund |
| Risk-adjusted (Sharpe-like) | SPY | Modest over QRFT; large over the rest |
| Drawdown reduction | DBMF | Genuine — but at the cost of return |
| Scale / closure risk | SPY | Decisive vs the equity-AI funds |
| Headline income (yield) | DBMF | 5.2% — but partially ordinary-income and ROC |
FAQ
Q: Why is the title "12 Months" but the analysis uses 5 years?
Twelve-month windows dominate fund-marketing materials because they're flattering or unflattering enough to support whatever case the issuer wants to make. The honest review uses the full live track record — five years here, more than eight for AIEQ — because that captures multiple regimes (the 2021 rally, the 2022 drawdown, the 2023-2025 recovery) rather than a single one.
Q: Doesn't AI improve over time? Maybe the older live data underweights what these funds can do now.
This is a fair critique. The counter is that every active strategy benefits from this argument, and most don't deliver on it. Without a clear, falsifiable claim about exactly what changed in the model and when, "the AI is better now" is unfalsifiable. If the model has changed materially, the live track record before the change is no longer relevant — but then the fund is effectively new, and the 5Y record being marketed is misleading.
Q: DBMF looks interesting. Is it a substitute for AI-equity exposure?
No — they're different exposures. DBMF replicates trend-following / managed-futures hedge funds, which have historically shown low correlation to U.S. equity and provide ballast in equity drawdowns (2022 is the clearest recent example). It is a potential diversifier alongside an equity core, not a substitute for it. The 5.2% headline yield is partly distributions of short-term gains and return-of-capital, so tax treatment matters — DBMF works better in tax-deferred accounts.
Q: Is there a regime in which these AI ETFs would be expected to outperform?
The clearest theoretical case is during factor-leadership transitions — moments when classic factors (value, momentum, quality) shift relative ranking and a fast-adapting model could rotate ahead of slower rules-based approaches. The 2020-2022 period contained at least two such transitions and the funds in this review did not capitalize on either.
Q: Does the current macro context change the read?
Modestly. With the 10-year Treasury at 4.47% and VIX at 17.26 (FRED and CBOE, asof 2026-05-14), we are in a moderate-volatility regime with positive real rates. AI-quant equity strategies are most often pitched as defensive in high-vol regimes. The 2026 environment is not extreme on either dimension, so we are not in the regime most favorable to the AI-quant pitch. But the 2022 drawdown was, and the funds underperformed there too.
What this comparison can and can't tell you
Five years covers one full cycle, not many. AIEQ has eight years of live data and the result is worse — but eight years is still a single cycle in macro terms. We don't have a 2008-scale stress test for any of these funds. The QRAFT funds have changed their underlying models repeatedly since launch, so part of the live track record is not the model currently in production. The DBMF replication factor weights are re-estimated quarterly and may drift over very long horizons. None of these uncertainties invalidates the data we have — they just mean the data should be read as "the live evidence so far," not "the verdict."
Scenarios where each fund fits
- Investor seeking U.S. equity core exposure in a long-horizon account → SPY (or any low-cost S&P 500 / total-market alternative). The case for paying 0.75% for AI-driven security selection has not been met by the live evidence in this window.
- Investor wanting a small explore-bucket position in AI-driven equity → QRFT is the most defensible of the AI-equity names on risk-adjusted terms over the five-year window. Position size should be small, and the investor should accept the closure risk of a sub-$20M fund.
- Investor seeking equity-drawdown diversification → DBMF is worth studying — not as an AI play but as a managed-futures replicator. Best held in a tax-advantaged account given its distribution profile. Our piece on combining diversification with predictive systems explores the broader allocation logic.
- Investor attracted to factor rotation → FCTR's record is a caution. Rules-based rotation requires the rotation rule to work in the regime you are in, and it didn't in 2020-2025.
Editor's read
If forced to pick one fund in this group for a long-horizon core position, the editor would not pick any of them — SPY (or its lower-cost cousins) does the job better. If forced to allocate a small satellite sleeve to a systematic strategy that isn't U.S. equity beta, the editor leans toward DBMF: it's the only fund in the review with a distinctly different return distribution from the index, it has real scale, and the underlying strategy (managed-futures replication) has a longer academic and practitioner record than the AI-equity case. The "AI" branding on the equity funds remains, in this editor's view, a marketing layer over what is functionally active equity management — and the live evidence is that active equity, on average, lags low-cost beta over multi-decade horizons. Five years is not a verdict, but it is not encouraging.
Editor's holdings disclosure: the editor does not hold AIEQ, AMOM, QRFT, FCTR, or DBMF at the time of writing. The editor holds an S&P 500 index position as part of a buy-and-hold core.
Methodology
Price, NAV, AUM, expense ratio, and dividend yield were pulled from yfinance on 2026-05-16 and cross-checked against each issuer's fact sheet (Amplify ETFs for AIEQ; QRAFT Technologies for AMOM and QRFT; iMGP DBi for DBMF; First Trust for FCTR; State Street SPDR for SPY). Five-year CAGR, realized volatility (annualized standard deviation of daily total returns), and max drawdown are computed on adjusted-close total return series ending 2026-05-15. Macro context (10-year Treasury, fed funds rate, VIX, CPI YoY) is from FRED, asof dates per the underlying series. The risk-free proxy used in the Sharpe-like discussion is the effective fed funds rate (3.64%, FRED, 2026-04-01). The framework for this comparison — cost, return, realized risk, scale, and tax treatment evaluated jointly — is the same methodology the editor uses for weekly review of an in-house portfolio dashboard.
This article is for educational purposes and does not constitute personalized financial advice. See full Disclaimer.