The short version
- Over the trailing 5 years, GLD returned 19.4% CAGR with 17.9% volatility; SLV returned 21.9% CAGR with 36.0% volatility — silver earned roughly 2.5 percentage points more per year while taking twice the risk.
- SLV's maximum 5-year drawdown of -42.5% is double GLD's -21.0%, and silver's industrial demand link means it can correlate with equities exactly when a hedge is most needed.
- The choice is not "which metal wins" but which role each one plays: gold as a low-correlation ballast, silver as a higher-beta cyclical satellite — sized very differently.
Gold has compounded at 19.4% per year over the trailing five years; silver at 21.9% (yfinance, asof 2026-05-18). Both numbers reflect a single regime — one shaped by a 4% real 10-year yield, a sticky inflation print, and an unusually concentrated central-bank gold-buying cycle. The more durable difference between GLD and SLV is not which one returned more. It is how each one got there, and what that path implies for the role each metal should play in a long-horizon allocation.
This is the question worth answering before the ticker question: do you want a low-correlation ballast, or do you want a cyclical satellite that happens to live under the "precious metals" label?
The 90-second orientation
SPDR Gold Shares (GLD) and iShares Silver Trust (SLV) are both physically-backed grantor trusts. They hold bullion in vaulted storage and issue shares against it. There are no futures, no roll yield, no contango drag in the strict sense — the expense ratio is the storage and administration cost, fully transparent. GLD launched in November 2004 and is the largest gold ETF in the world by AUM; SLV launched in April 2006 and is the largest silver vehicle by the same measure.
What these products do not do is pay a yield. Both have a dividend yield of 0.0%. Total return is entirely a function of spot price movement minus the expense ratio, minus a small bid-ask cost on entry and exit. That asymmetry — no carry, only price — is the single most important fact for a long-horizon investor weighing them against equity or fixed-income allocations.
The actual numbers
| Metric | GLD | SLV |
|---|---|---|
| Issuer | State Street (SPDR) | BlackRock (iShares) |
| Inception | 2004-11-18 | 2006-04-21 |
| Expense ratio | 0.40% | 0.50% |
| AUM | $153.5B | $35.6B |
| Dividend yield | 0.0% | 0.0% |
| 5Y CAGR | 19.4% | 21.9% |
| 10Y CAGR | 13.2% | 15.6% |
| 5Y annualized volatility | 17.9% | 36.0% |
| 5Y max drawdown | -21.0% | -42.5% |
Sources: yfinance for price-derived metrics, fetched 2026-05-18. Expense ratios and AUM from issuer fact sheets: SPDR Gold Shares for GLD and the iShares Silver Trust page for SLV.
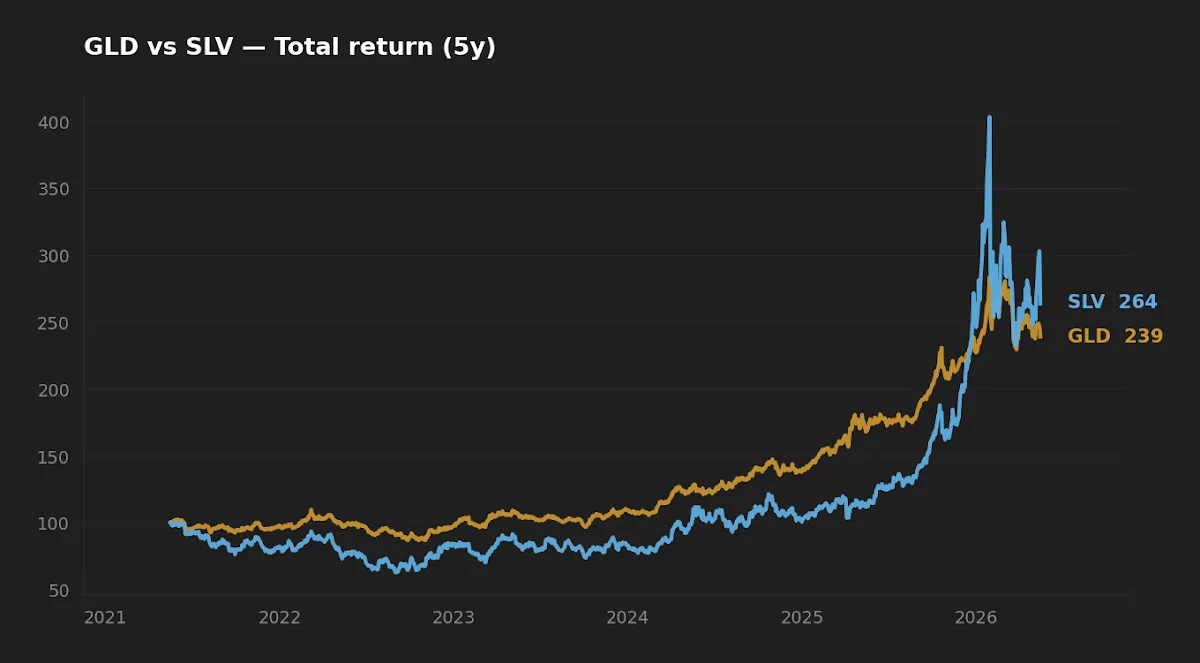
Return per unit of realized risk, not return alone
The 2.5-percentage-point CAGR gap in silver's favor is the headline number, and it is the wrong number to optimize against. Silver delivered that extra return while running roughly twice the realized volatility (36.0% vs 17.9%) and producing a maximum drawdown twice as deep (-42.5% vs -21.0%).
Using the prevailing fed funds rate of 3.64% as a proxy risk-free benchmark (FRED, asof 2026-04-01), the realized risk-adjusted figures over the trailing five years look very different from the raw CAGRs:
- GLD: (19.4% − 3.64%) / 17.9% ≈ 0.88
- SLV: (21.9% − 3.64%) / 36.0% ≈ 0.51
That is a meaningful gap. Silver's marginal return per unit of realized volatility is roughly 58% of gold's. For an investor whose objective function is total wealth — not just total return — that math is the relevant one, because position sizing has to compensate for the volatility before it compensates for the return.
Why silver's drawdown profile is structurally different
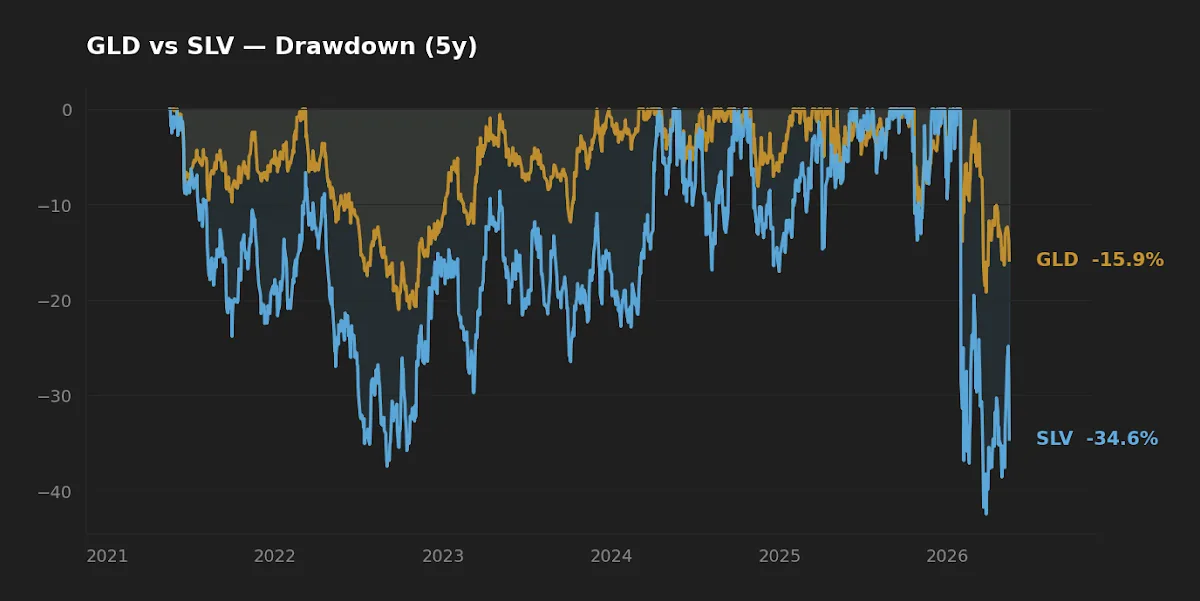
Roughly half of global silver demand is industrial — solar photovoltaics, electronics, automotive, brazing alloys. Gold demand is dominated by jewelry, investment, and central-bank reserves, with industrial use a single-digit share. That composition difference is the structural reason silver's drawdowns are deeper and its correlation profile less reliable as a hedge.
In a deflationary growth shock, industrial demand for silver falls alongside equity earnings expectations. Silver can therefore correlate with the equity portfolio in exactly the regime where an investor most wants the hedge to work. Gold, with no comparable industrial linkage and a structural central-bank bid, tends to behave more independently of equity cash-flow risk and more directly tied to real-yield dynamics.
Silver behaves like a higher-beta cousin of gold in inflation regimes and a higher-beta cousin of equities in deflationary shocks — which is a different asset from the one most allocation models assume.
The implication for portfolio construction is asymmetric. Doubling silver's weight to match gold's volatility budget does not double its diversification value, because part of the variance it adds is now correlated with the equity sleeve it was supposed to offset. This is the non-obvious cost of treating SLV as a "more aggressive GLD." It is not the same exposure scaled up. It is a different exposure that happens to share a category label.
The macro context behind the trailing returns
It matters that both metals printed strong trailing numbers in the same regime. As of mid-2026, the 10-year Treasury sits at 4.47%, the fed funds rate at 3.64%, CPI year-over-year at 3.9%, and the VIX at 17.3 (FRED, asof 2026-05-14 for rates and VIX; 2026-04-01 for CPI). The implied real 10-year yield is roughly 0.5% — historically low for a non-recessionary environment, and a textbook setup for gold appreciation given gold's well-documented inverse relationship to real yields.
Layered on top is a multi-year central-bank gold-buying cycle that has structurally lifted demand. Silver has ridden the same monetary tailwind plus an industrial-demand boost from electrification. None of these conditions are guaranteed to persist. Extrapolating 19–22% CAGRs forward as a base case is the same mistake retail equity investors made with U.S. large-cap growth in late 2021. The trailing window is a single regime, and the relevant academic caveat — single-regime risk — applies to backward-looking metal returns as much as it does to anything else.
For context on how to interpret these macro variables alongside an ETF allocation, the discussion in Gold, the Dollar, and Risk Assets in 2026 walks through the mechanism in more depth.
Cost, scale, and implementation friction
The 10 bp fee gap between GLD (0.40%) and SLV (0.50%) is real but not the decisive factor. Over a 20-year horizon at a 7% gross compounding rate, 10 bp compounds into roughly 2% of terminal wealth — meaningful, but small relative to the volatility differential. There are also lower-fee competitors in both categories (notably IAU for gold at 0.25%, and SIVR for silver at 0.30%) that an implementation-focused investor should at least consider. GLD's edge is liquidity: tighter bid-ask spreads, deeper options markets, and a larger creation-unit ecosystem.
The deeper friction is taxation. In U.S. taxable accounts, both GLD and SLV are taxed as collectibles, with long-term gains capped at 28% rather than the standard long-term capital-gains rate. That tax treatment alone can erode 200–300 bp of after-tax return relative to a comparable equity ETF and is the single most common oversight in retail precious-metals allocations. For investors comparing this allocation to the broader long-term framework discussed in the Precious Metals ETF Guide, the after-tax math should be done explicitly before sizing the position.
Scoreboard
| Category | Winner | Why |
|---|---|---|
| Cost | GLD | 0.40% vs 0.50%; tighter spreads at $153B AUM |
| Realized risk | GLD | 17.9% vol and -21.0% max DD vs 36.0% / -42.5% |
| Realized 5Y return | SLV | 21.9% CAGR vs 19.4% (single-regime caveat applies) |
| Risk-adjusted return | GLD | 0.88 vs 0.51 on (CAGR − rf) / vol basis |
| Diversification reliability | GLD | Lower industrial-demand linkage to equity earnings |
| Cyclical upside | SLV | Higher beta to inflation and electrification themes |
FAQ
Is GLD or SLV a better long-term hold?
For the role of a low-correlation portfolio ballast, GLD's risk profile and diversification reliability make it the more consistent choice. SLV is more accurately framed as a higher-beta cyclical satellite, not a like-for-like substitute.
Why is silver so much more volatile than gold?
Silver's market is smaller, less liquid, and roughly half-driven by industrial demand. That demand is procyclical, so silver picks up both inflation-hedge flows and industrial-cycle flows, with the two sometimes pulling in opposite directions.
Are GLD and SLV taxed the same as stock ETFs?
No. In U.S. taxable accounts both are taxed as collectibles, with long-term gains capped at 28%. This is a structurally less favorable treatment than the 15–20% long-term rate on most equity ETFs and should be modeled into expected after-tax return.
What allocation makes sense for either?
Typical long-horizon frameworks size a gold sleeve at 5–10% of the total portfolio with rebalancing bands (the Daryanani 2008 ±15/±25% framework is one defensible reference). Silver, if held at all, is usually a 1–3% satellite sized for its higher volatility — not a 1:1 replacement for the gold weight.
Should I hold the ETF or physical metal?
Each carries different costs: ETFs have annual expense ratios and counterparty considerations; physical has dealer spreads, storage, and insurance costs. The comparison is covered in more depth in Is It Better to Buy Gold ETF or Physical Gold.
What this comparison can and can't tell you
The five- and ten-year windows used here cover one inflation regime, one rate-cutting cycle followed by a sharp hiking cycle, and one period of extraordinary central-bank gold accumulation. They do not cover a sustained deflationary shock, a credit-driven equity bear market, or a prolonged high-real-yield regime — all of which historically reshape the relative behavior of gold and silver. The realized Sharpe-like ratios above should be read as descriptions of one regime, not as forecasts. Look-ahead bias is unavoidable in any backward-looking metric, and survivorship is not an issue here (neither product has ever closed) but liquidity assumptions during stress are not directly testable in this window.
Scenarios where each fits
- An investor in their 40s with a 70/30 equity/bond core and no current metals exposure: a 5–8% GLD sleeve, rebalanced annually against equity, adds a low-correlation drawdown buffer without changing the portfolio's character. Silver here adds variance without proportional diversification.
- An investor already holding gold who wants targeted inflation-and-electrification exposure: a 1–3% SLV satellite, sized small enough that its 42% drawdown does not destabilize the rebalancing schedule, is the defensible framing.
- A retiree drawing income: neither pays a yield, and the collectibles tax treatment is unattractive in taxable accounts. Sized small (≤5% combined) and held in a tax-deferred account if possible.
Editor's read
Between GLD and SLV as the metals sleeve of a long-term core, the editor leans toward GLD. The case is not that gold will outperform — silver did, by 2.5 percentage points annualized over the trailing five years. The case is that GLD does the job it is hired for more reliably: lower realized drawdown, less correlation drift in stress, and a behavioral profile that survives the next regime without requiring a thesis about industrial-demand cycles to make sense. Silver is interesting at a 1–3% satellite weight for an investor who has already filled the gold allocation and wants targeted electrification exposure. It is not a substitute for the ballast.
Editor's holdings disclosure: The editor holds GLD as part of the long-term core allocation and does not hold SLV at the time of writing.
Methodology
Price-derived metrics (CAGR, annualized volatility, maximum drawdown) calculated from yfinance daily total-return data over the trailing 5- and 10-year windows ending 2026-05-18. Expense ratios, AUM, dividend yield, and inception dates from issuer fact sheets (SPDR for GLD, iShares for SLV), retrieved 2026-05-18. Macro context (10-year Treasury, fed funds rate, VIX, CPI) from FRED, retrieved 2026-05-18 with individual as-of dates noted in the text. Risk-free proxy uses fed funds rate; using the 10-year Treasury yield instead would tighten both risk-adjusted ratios but not change the ordering.
This article is for educational purposes and does not constitute personalized financial advice. See full Disclaimer.